No Result
View All Result
  • Login
Sunday, September 20, 2026
FeeOnlyNews.com
  • Home
  • Business
  • Financial Planning
  • Personal Finance
  • Investing
  • Money
  • Economy
  • Markets
  • Stocks
  • Trading
  • Home
  • Business
  • Financial Planning
  • Personal Finance
  • Investing
  • Money
  • Economy
  • Markets
  • Stocks
  • Trading
No Result
View All Result
FeeOnlyNews.com
No Result
View All Result
Home Markets

15 Cities in America Where Homebuyers Compete for Aging Fixer-Uppers

by FeeOnlyNews.com
6 months ago
in Markets
Reading Time: 32 mins read
A A
0
15 Cities in America Where Homebuyers Compete for Aging Fixer-Uppers
Share on FacebookShare on TwitterShare on LInkedIn


wotgat / Shutterstock.com

Editor’s Note: This story originally appeared on Construction Coverage.

Today’s real estate market is a challenging one for buyers. While home prices have relaxed since their peak in the COVID-19 pandemic, the typical cost of a home in the U.S. has risen by more than 23% from early 2020 through the end of 2025.

Compounding the housing affordability problem further, mortgage rates remain at elevated levels not seen since before the Great Recession. Additionally, the impacts of high rent and inflation have made it harder for many would-be buyers to save up for home purchases.

Underlying all of these conditions is the simple fact that America has been slow to add new homes to its housing supply.

Estimates of the national housing shortfall range between 1.5 and 7.3 million housing units relative to the needs of the current population. One of the primary reasons is that many construction firms downsized or went out of business entirely during the Great Recession, leading to a long stretch of underbuilding.

This prolonged underinvestment has led to an aging housing stock, leaving buyers to contend with homes that often require expensive repairs, costly renovations, and higher energy bills.

To better understand where these effects are most pronounced, researchers at Construction Coverage examined patterns in housing age using the latest data from the U.S. Census Bureau. For more information, refer to the methodology at the end.

Here are the cities with the oldest homes.

15. St. Louis, MO-IL

Homes in St. Louis Missouri
Rob Neville Photos / Shutterstock.com

Median home age: 50
Median year built: 1974
Share of homes built before 1980: 57.5%
Share of homes built before 1940: 15.1%
Share of homes built since 2010: 9.6%

14. Chicago-Naperville-Elgin, IL-IN
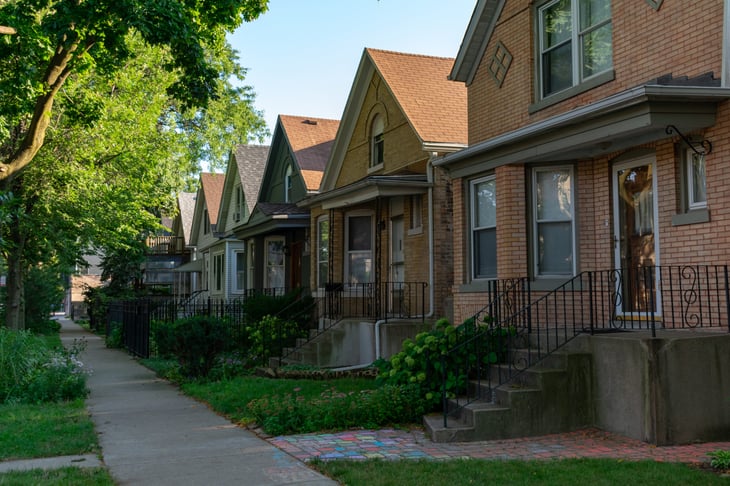
Homes in Chicago
James Andrews1 / Shutterstock.com

Median home age: 52
Median year built: 1972
Share of homes built before 1980: 61.1%
Share of homes built before 1940: 19.7%
Share of homes built since 2010: 7.1%

13. Los Angeles-Long Beach-Anaheim, CA

Home in Los Angeles
divanov / Shutterstock.com

Median home age: 55
Median year built: 1969
Share of homes built before 1980: 66.2%
Share of homes built before 1940: 11.6%
Share of homes built since 2010: 7.8%

12. San Francisco-Oakland-Fremont, CA

Homes in San Francisco, California
Sergey Novikov / Shutterstock.com

Median home age: 56
Median year built: 1968
Share of homes built before 1980: 65.6%
Share of homes built before 1940: 20.0%
Share of homes built since 2010: 8.8%

11. Detroit-Warren-Dearborn, MI

Houses in Detroit
Matthew G Eddy / Shutterstock.com

Median home age: 56
Median year built: 1968
Share of homes built before 1980: 65.6%
Share of homes built before 1940: 13.3%
Share of homes built since 2010: 6.3%

10. Milwaukee-Waukesha, WI

Milwaukee homes
Henryk Sadura / Shutterstock.com

Median home age: 56
Median year built: 1968
Share of homes built before 1980: 66.1%
Share of homes built before 1940: 19.8%
Share of homes built since 2010: 7.9%

9. Hartford-West Hartford-East Hartford, CT

Hartford, Connecticut
JTMC / Shutterstock.com

Median home age: 56
Median year built: 1968
Share of homes built before 1980: 67.8%
Share of homes built before 1940: 18.7%
Share of homes built since 2010: 5.4%

8. Rochester, NY
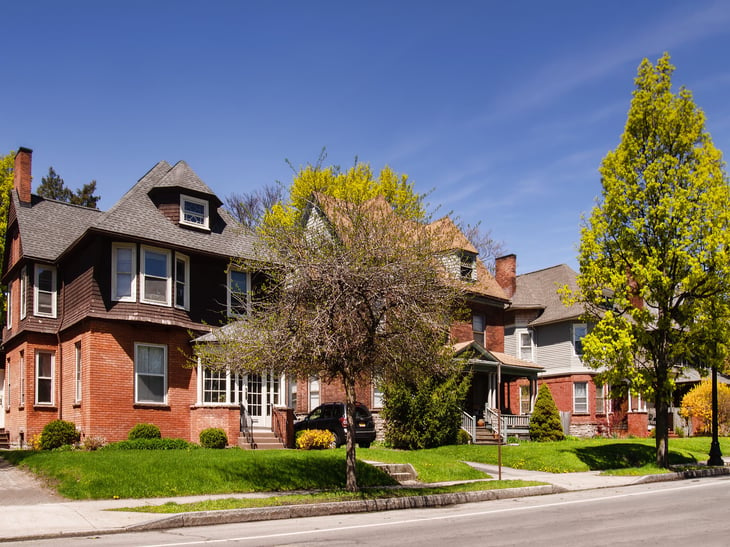
Rochester, NY
debra millet / Shutterstock.com

Median home age: 57
Median year built: 1967
Share of homes built before 1980: 67.0%
Share of homes built before 1940: 26.3%
Share of homes built since 2010: 6.7%

7. Philadelphia-Camden-Wilmington, PA-NJ-DE-MD

Homes in Philadelphia
Olga V Kulakova / Shutterstock.com

Median home age: 58
Median year built: 1966
Share of homes built before 1980: 65.3%
Share of homes built before 1940: 21.6%
Share of homes built since 2010: 8.4%

6. Boston-Cambridge-Newton, MA-NH

Boston, Massachusetts
Sunny Chanruangvanich / Shutterstock.com

Median home age: 59
Median year built: 1965
Share of homes built before 1980: 65.0%
Share of homes built before 1940: 30.7%
Share of homes built since 2010: 10.5%

5. Providence-Warwick, RI-MA

Home in Providence, Rhode Island
Laura Stone / Shutterstock.com

Median home age: 60
Median year built: 1964
Share of homes built before 1980: 68.5%
Share of homes built before 1940: 29.2%
Share of homes built since 2010: 6.1%

4. Cleveland, OH

Cleveland, Ohio
Pedro Gutierrez / Shutterstock.com

Median home age: 61
Median year built: 1963
Share of homes built before 1980: 70.4%
Share of homes built before 1940: 21.5%
Share of homes built since 2010: 6.2%

3. New York-Newark-Jersey City, NY-NJ

Newark, New Jersey
EQRoy / Shutterstock.com

Median home age: 63
Median year built: 1961
Share of homes built before 1980: 71.7%
Share of homes built before 1940: 27.1%
Share of homes built since 2010: 8.0%

2. Pittsburgh, PA
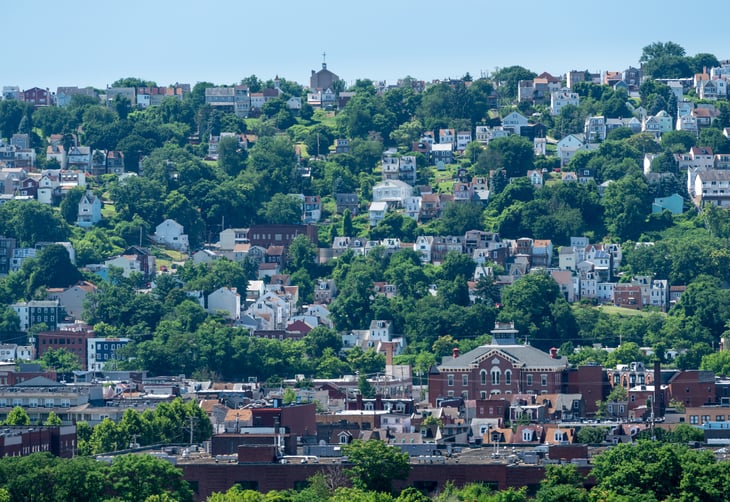
Pittsburgh homes
Steve Heap / Shutterstock.com

Median home age: 64
Median year built: 1960
Share of homes built before 1980: 72.3%
Share of homes built before 1940: 25.3%
Share of homes built since 2010: 6.8%

1. Buffalo-Cheektowaga, NY
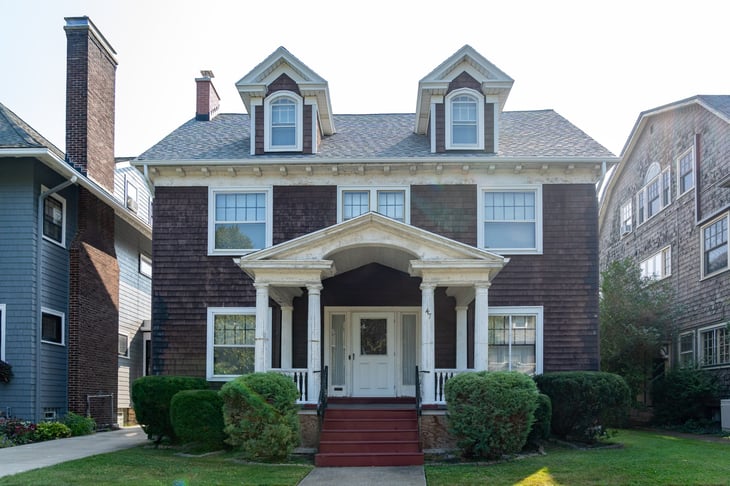
Townhouse in Buffalo, New York
CEW / Shutterstock.com

Median home age: 66
Median year built: 1958
Share of homes built before 1980: 76.6%
Share of homes built before 1940: 29.1%
Share of homes built since 2010: 5.4%

Methodology

Business analyst woman working in an office on a computer and analyzing data
Undrey / Shutterstock.com

The data used in this analysis is from the U.S. Census Bureau’s 2024 American Community Survey 1-Year Estimates.

To determine the locations with the oldest homes, researchers calculated the median age of residential housing units based on the year each unit was built. In the event of a tie, the location with the larger percentage of homes built before 1980 was ranked higher.

To improve relevance, metropolitan statistical areas were grouped into cohorts based on population size.


Source link

Tags: agingAmericaCitiescompeteFixerUppersHomebuyers
ShareTweetShare
Previous Post

Carnival Corporation & plc (CCL) Reports Q1 Earnings

Next Post

10 Things You Should Never Do in the Grocery Store

Related Posts

All signs are pointing to the total and imminent collapse of the United States housing market.

All signs are pointing to the total and imminent collapse of the United States housing market.

by FeeOnlyNews.com
August 7, 2026
0

All signs are pointing to the total and imminent collapse of the United States housing market.What is about to happen...

Cities holding up to 3 million people found under Amazon rain forest

Cities holding up to 3 million people found under Amazon rain forest

by FeeOnlyNews.com
August 7, 2026
0

Archaeologists have officially discovered a massive, completely lost ancient civilization hidden deep beneath the Amazon rainforest using advanced LiDAR laser...

nLIGHT Releases Q2 2026 Financial Results

nLIGHT Releases Q2 2026 Financial Results

by FeeOnlyNews.com
August 7, 2026
0

AlphaStreet Newsdesk powered by AlphaStreet Intelligence LASR|EPS $0.15 vs $0.14 est (+7.1%)|Rev $82.6M|Net Loss $1.3M Q2 2026 non-GAAP earnings at...

The  Burrito Debate Reveals GOP’s Affordability Rift

The $20 Burrito Debate Reveals GOP’s Affordability Rift

by FeeOnlyNews.com
August 7, 2026
0

Sometimes a burrito isn’t just a burrito. What started as a complaint about a $20 burrito has turned into one...

Doximity shares double. Here’s what’s driving it 

Doximity shares double. Here’s what’s driving it 

by FeeOnlyNews.com
August 7, 2026
0

Doximity at the New York Stock Exchange for its initial public offering on June 24, 2021.Source: NYSEShares of medical platform...

E.W. Scripps Q2 2026 Loss Widens to -.68/Share, Revenue Down 9%

E.W. Scripps Q2 2026 Loss Widens to -$12.68/Share, Revenue Down 9%

by FeeOnlyNews.com
August 7, 2026
0

AlphaStreet Newsdesk powered by AlphaStreet Intelligence SSP|Loss Per Share $12.68 vs -$0.40 est (-3070.0%)|Rev $490.4M|Net Loss $1.15B Stock $2.95 (+2.8%)...

Next Post
Carnival Corporation & plc (CCL) Q1 2026 Earnings Recap

Carnival Corporation & plc (CCL) Q1 2026 Earnings Recap

Southland Holdings, Inc. (SLND) Q4 Earnings: Misses on EPS, Revenue Recap

Southland Holdings, Inc. (SLND) Q4 Earnings: Misses on EPS, Revenue Recap

  • Trending
  • Comments
  • Latest
Bitcoin and ethereum prices today, Friday, August 7, 2026: Crypto prices moving higher following July jobs report

Bitcoin and ethereum prices today, Friday, August 7, 2026: Crypto prices moving higher following July jobs report

August 7, 2026
MEXC Lists Ondo Yield Asset As Tokenized Treasury Demand Grows

MEXC Lists Ondo Yield Asset As Tokenized Treasury Demand Grows

July 3, 2026
Delek Logistics Partners Reports alt=

Delek Logistics Partners Reports $0.54 EPS for Q2 FY26

August 5, 2026
Onkure Therapeutics Releases Q2 2026 Financial Results

Onkure Therapeutics Releases Q2 2026 Financial Results

August 4, 2026
Thryv outlines M run-rate savings while revising 2026 SaaS adjusted EBITDA to M-M (NASDAQ:THRY)

Thryv outlines $60M run-rate savings while revising 2026 SaaS adjusted EBITDA to $42M-$44M (NASDAQ:THRY)

August 4, 2026
My Thoughts on Going All In

My Thoughts on Going All In

August 4, 2026
Advanced Micro Devices (AMD) Price Prediction: How Much a ,000 Investment Could Be Worth by 2031

Advanced Micro Devices (AMD) Price Prediction: How Much a $5,000 Investment Could Be Worth by 2031

0
Cities holding up to 3 million people found under Amazon rain forest

Cities holding up to 3 million people found under Amazon rain forest

0
Republican Party Displacement | Mises Institute

Republican Party Displacement | Mises Institute

0
Bybit Uses Tokenised Equities as Underlyings for Structured Yield

Bybit Uses Tokenised Equities as Underlyings for Structured Yield

0
Explained: How BSE traded fewer contracts after CAS but premiums rose 75% in first week

Explained: How BSE traded fewer contracts after CAS but premiums rose 75% in first week

0
Vaxart outlines Phase IIb COVID-19 top line data in first half of 2027 backed by BARDA funding (OTCMKTS:VXRT)

Vaxart outlines Phase IIb COVID-19 top line data in first half of 2027 backed by BARDA funding (OTCMKTS:VXRT)

0
Advanced Micro Devices (AMD) Price Prediction: How Much a ,000 Investment Could Be Worth by 2031

Advanced Micro Devices (AMD) Price Prediction: How Much a $5,000 Investment Could Be Worth by 2031

August 8, 2026
Republican Party Displacement | Mises Institute

Republican Party Displacement | Mises Institute

August 8, 2026
Vanguard Chief Economist: AI and jobs, still in an ATM phase

Vanguard Chief Economist: AI and jobs, still in an ATM phase

August 8, 2026
Explained: How BSE traded fewer contracts after CAS but premiums rose 75% in first week

Explained: How BSE traded fewer contracts after CAS but premiums rose 75% in first week

August 8, 2026
Democrats’ Affordability Message Misses a Key Expense—Student Debt

Democrats’ Affordability Message Misses a Key Expense—Student Debt

August 8, 2026
Banks or NBFCs? DSP’s Preethi R S explains where she sees the best opportunities

Banks or NBFCs? DSP’s Preethi R S explains where she sees the best opportunities

August 8, 2026
FeeOnlyNews.com

Get the latest news and follow the coverage of Business & Financial News, Stock Market Updates, Analysis, and more from the trusted sources.

CATEGORIES

  • Business
  • Cryptocurrency
  • Economy
  • Financial Planning
  • Investing
  • Market Analysis
  • Markets
  • Money
  • Personal Finance
  • Startups
  • Stock Market
  • Trading

LATEST UPDATES

  • Advanced Micro Devices (AMD) Price Prediction: How Much a $5,000 Investment Could Be Worth by 2031
  • Republican Party Displacement | Mises Institute
  • Vanguard Chief Economist: AI and jobs, still in an ATM phase
  • Our Great Privacy Policy
  • Terms of Use, Legal Notices & Disclaimers
  • About Us
  • Contact Us

Copyright © 2022-2024 All Rights Reserved
See articles for original source and related links to external sites.

Welcome Back!

Sign In with Facebook
Sign In with Google
Sign In with Linked In
OR

Login to your account below

Forgotten Password?

Retrieve your password

Please enter your username or email address to reset your password.

Log In
No Result
View All Result
  • Home
  • Business
  • Financial Planning
  • Personal Finance
  • Investing
  • Money
  • Economy
  • Markets
  • Stocks
  • Trading

Copyright © 2022-2024 All Rights Reserved
See articles for original source and related links to external sites.