In This Article
Foreword by Dave Meyer
In a new era of real estate investing, the old rules of thumb no longer work.
Back in the day of cheap homes and high rents, you could confidently use rent-to-price ratios (one month of rent divided by the purchase price) to estimate cash flow. If you hit the magical 1% target for rent-to-price or at least got close to it, you were good to go.
Unfortunately, in today’s era of higher interest rates, insurance costs, taxes, and pretty much higher everything, those metrics no longer cut it. We need new metrics to identify good deals, so I created one and ranked the largest U.S. cities by it. I’m calling it the Rent-to-Payment Ratio, and the formula is to divide one month’s rent by one month’s total mortgage payment (principal, interest, taxes, and insurance, aka PITI).
By comparing your total payment rather than purchase price, you better account for interest rate changes and how much insurance costs and taxes vary by state.
After ranking every metro by rent-to-payment, we can establish new benchmarks for cash flow estimates here in 2026, and the gold standard is still around 1.0. Anything that hits 1.0 or higher should have strong cash flow, but 1.0 is not some magical number.
According to my analyses, anything with a rent-to-payment ratio of 0.75 or above should still offer cash flow opportunities, and any market with a rent-to-payment ratio below that number will make cash flow difficult but not impossible to find.
The rankings are meant to identify cash flow potential but should not be seen as the be-all and end-all of cash flow evaluation. Remember that even in a city that averages 0.6 rent-to-payment, by rule, half the properties still have a rent-to-payment above that number!
These are averages on a metro level, not an evaluation of individual properties. It’s your job as an investor, no matter the market, to find deals that exceed those averages whenever possible.
One other reminder: Rent-to-payment ratios, my ranks, or any other rules of thumb are not meant as proper deal analyses. These are tools to help you narrow down your potential markets or deals. You still need to run a proper analysis before buying anything, which you can do with the BiggerPockets calculators.
All that being said, I find these results encouraging! There are multiple cities in the U.S. with rent-to-payment ratios above 1.0—which is great—and plenty of others with strong income potential for investors.
So, get to it! Take a look at the list, find some great cash-flowing markets, and then get out there and find a deal.
– Dave Meyer, Chief Investment Officer at BiggerPockets
The New Benchmark: Cash Flow Is Not a Default—It Needs to Be Discovered
Across the 54 tracked metros, the average rent-to-payment ratio is roughly 0.80, with a median of 0.76, meaning that in the “typical” big-city deal, market rent covers only 76%-80% of the full monthly cost of ownership (PITI).
A ratio of 1.0 used to be standard. Now it is the gold standard—where rent covers principal, interest, taxes, and insurance—while 0.75-1.0 remains workable, and anything below 0.75 is an uphill struggle for cash flow that will require either below-market house pricing, above-market rents, or aggressive value-adds to boost rents, which will cost investors.
For sophisticated investors, the hunt is framed not in terms of cash flow but rather in which metros the deal averages close to break-even and where they can use their skills in sourcing, underwriting, and value-add to move the needle.
Where Cash Flow Lives: Midwest and Northeast Workhorses
A pattern exists in many of the “cash-flow metros”: Home prices stayed cheap, while rents either held up or reset higher as national affordability shrank.
At the top of the table, Detroit posts an impressive rent-payment ratio of 1.99, meaning that average market rent is almost double the modeled all-in monthly cost of owning a city-limit property.
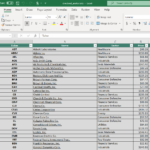
Here’s the rest of the top 10, clustered around break-even stats:
Home Values
Detroit has an average home value of about $72,000. However, with a $1,280 monthly rent and modest principal-and-interest payments, along with relatively low taxes and insurance, there is a wide net operating income margin even after expenses. For an investor, the gap between rent and PITI is a buffer against vacancy, capital expenditures, and future tax rate increases.
Midwest markets such as Cleveland, St. Louis, Cincinnati, Indianapolis, Columbus, Chicago, and Kansas City all sit in the workable range—typically between 0.81 and 1.19—with taxes and insurance high enough to make a difference but not so high as to cripple the payment. In these cities, underwriting will depend more on rental amounts, tenant quality, and neighborhood selection than on whether PITI has surpassed the rent ceiling.
What the Data Doesn’t Tell You
What the data doesn’t tell you is what kind of house you are getting for under $80,000 in Detroit—or in any city—and in what neighborhood. Theoretical cash flow is one thing, but real-world experience, factoring in crime and socioeconomic conditions, also plays a part and can devour profit in an instant.
This is where microdata and experienced, trustworthy partners/agents and brokers are essential. Cash flow on paper doesn’t always translate in real life, so don’t take the data as sacrosanct. This is a general overview. Always do your due diligence.
At the Tough End: When Cash Flow Is a Nonstarter
At the bottom of the list, high prices, not weak rents, drive down the ratios. San Jose, with a rent-to-payment ratio near 0.39; San Francisco at 0.52; Los Angeles at 0.49; Seattle at 0.49; and San Diego at 0.56 all show strong rents—but their home values and resulting PITI simply outpace what tenants can reasonably be expected to pay.
Austin—once a pandemic-era hotbed—has joined these low-ratio ranks, with a rent-to-payment ratio of about 0.40, as prices have reset only partially and rents have softened.
In these pricey metros, investors are buying for appreciation and as a safe place to park cash. Thus, buying all cash here is the practical way to go, unless you are an owner-occupant and can cover the mortgage payment. The only other option is a value-add scenario—adding bedrooms or ADUs—to bring cash flow to a break-even point or to flip.
In the modern investment era, price is not everything. Taxes and insurance have soared in recent years, so much so that they can derail what would once have been a perfectly good deal, cost-wise. This is no more evident than in Oklahoma City, where the rent-to-payment ratio of 0.56 is so low in part because homeowner’s insurance alone accounts for roughly 40% of PITI, making it one of the highest shares in the country.
In Houston, Miami, Dallas, and other cities vulnerable to extreme weather—particularly storms and hail—elevated insurance and property tax costs significantly constrain the spread, submerging cash flow uncertainty under the weight of high expenses.
The Regional Divide: Why The Midwest Wins—on Average
One underlying theme is unmistakable from the data: The Midwest is the only region that cash flows, posting a mean rent-to-payment ratio of about 1.01—just above break-even. The Northeast follows at roughly 0.89, the South at 0.78, and the West lags far behind at 0.61. This means that in major western metros, the typical deal is nearly 40% underwater on PITI—even before maintenance and reserves are factored in.
For investors, these regional demarcations clearly have major implications:
Midwest: Investors need to drill down to examine submarkets, and sometimes specific streets, property types, and investment strategies, to maximize durable, scalable cash flow from a generally favorable dataset.
Northeast: With robust, populous, high-demand cities like New York, Boston, and Philadelphia, the trade-off is lower ratios for tenant demand and tight supply, with most cash flow and stable appreciation.
South: The map is uneven, with unglamorous, blue-collar cities such as Memphis and Birmingham giving off strong cash flow. Conversely, more upscale cities with modern businesses, like Austin, Atlanta, Nashville, Tampa, and Houston, are too pricey—like California cities—to generate any cash flow from rents.
West: It’s good for parking cash and long-term appreciation, but cash flow, with leveraged debt, is a nonstarter.
Why Payment Beats Price: Underwriting in a High-Cost World
In 2026, a key shift in professional underwriting has been long overdue—because rent-to-price ratios are no longer enough. Taxes and insurance, as we have seen, often constitute a large chunk of an investor’s expenses. By calculating monthly rent-to-payment ratios using the full monthly PITI at 6.5%, a 30-year fixed rate, and a 20% down payment—including city-level taxes and insurance—the dataset captures the true exposure for investors when rates and non-loan costs spike.
The impact is most dramatic when taxes and insurance deviate wildly from national norms. We already looked at Oklahoma City, where insurance is 40% of the payment. In Houston and Miami, high wind and flood risks have driven up annual premiums to an average of $7,860 and $6,000, respectively. Conversely, in places like Birmingham and Indianapolis, very low effective tax rates and moderate insurance keep PITI in check, allowing rent to absorb more of the costs.
For a sophisticated investor, a correlation between your payment composition and your market selection is essential if cash flow is your ultimate goal. There’s more to it, however. Looking at the overall picture holistically, there needs to be an equilibrium between price and non-mortgage-related costs.
Try to select markets where taxes and insurance have scaled reasonably with price, leaving room for rent growth to translate into cash flow. Equally, be wary of markets where policy or climate risk has inflated non-loan costs. In these instances, negotiating a great deal on price may not rescue a weak rent-to-payment ratio profile.
Investor’s Lens: Using the Rankings to Deploy Capital
If you’re building or expanding a portfolio in 2026, this dataset offers a practical investment roadmap but not a definitive guide, as prices and costs often vary by neighborhood.
That said, certain guidelines are helpful:
Use high-ratio metros: Detroit, Cleveland, Memphis, Birmingham, Hartford, St. Louis, and their peers are primary cash flow-hunting grounds.
Treat mid-range metros: Many in the Northeast and interior South are balanced plays, where cash flow exists, but you are more likely to find a mix of modest cash flow and appreciation.
Approach low-ratio metros such as Austin and West Coast cities as specialty markets: These are places where short-term rentals or cash purchases are for long-term equity appreciation and tax write-offs.
Final Thoughts
The optimistic note here is that even at 6.5% interest, high prices, and soaring taxes and insurance in many markets, there are large swathes of the U.S. where cash flow—or at least breaking even—has not disappeared. By using this rent-to-payment guide, you have a realistic tool that is not built on real estate agent or wholesaler hype or misdirection but on concrete numbers that even the playing field.
It’s a good first step—there are many more to take—but at least you’re facing in the right direction.
Editor’s Note: Thanks for reading! As a special offer for our readers, save $100 on your ticket to BPCON2026—BiggerPockets’ annual real estate investing conference—using code MYRE100 at checkout.
You might also like