Updated on May 27th, 2026 by Bob Ciura
In the world of investing, volatility matters. Investors are reminded of this every time there is a downturn in the broader market and individual stocks that are more volatile than others experience enormous swings in price.
Volatility is a proxy for risk; more volatility generally means a riskier portfolio. The volatility of a security or portfolio against a benchmark is called Beta.
In short, Beta is measured via a formula that calculates the price risk of a security or portfolio against a benchmark, which is typically the broader market as measured by the S&P 500.
Here’s how to read stock betas:
A beta of 1.0 means the stock moves equally with the S&P 500
A beta of 2.0 means the stock moves twice as much as the S&P 500
A beta of 0.0 means the stocks moves don’t correlate with the S&P 500
A beta of -1.0 means the stock moves precisely opposite the S&P 500
Interestingly, low beta stocks have historically outperformed the market… But more on that later.
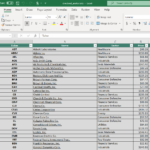
You can download a spreadsheet of the 100 lowest beta S&P stocks (along with important financial metrics like price-to-earnings ratios and dividend yields) below:
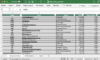
This article will discuss beta more thoroughly, why low-beta stocks tend to outperform, and provide a discussion of the 5 lowest-beta dividend stocks in the Sure Analysis Research Database.
The table of contents below allows for easy navigation.
Table of Contents
The Evidence for Low Beta Stocks Outperformance
Beta is helpful in understanding the overall price risk level for investors during market downturns in particular. The lower the Beta value, the less volatility the stock or portfolio should exhibit against the benchmark.
This is beneficial for investors for obvious reasons, particularly those that are close to or already in retirement, as drawdowns should be relatively limited against the benchmark.
Importantly, low or high Beta simply measures the size of the moves a security makes; it does not mean necessarily that the price of the security stays nearly constant.
Securities can be low Beta and still be caught in long-term downtrends, so this is simply one more tool investors can use when building a portfolio.
The conventional wisdom would suggest that lower Beta stocks should underperform the broader markets during uptrends and outperform during downtrends, offering investors lower prospective returns in exchange for lower risk.
However, history would suggest that simply isn’t the case.
Indeed, this paper from Harvard Business School suggests that not only do low Beta stocks not underperform the broader market over time – including all market conditions – they actually outperform.
A long-term study wherein the stocks with the lowest 30% of Beta scores in the US were pitted against stocks with the highest 30% of Beta scores suggested that low Beta stocks outperform by several percentage points annually.
Over time, this sort of outperformance can mean the difference between a comfortable retirement and having to continue working.
While low Beta stocks aren’t a panacea, the case for their outperformance over time – and with lower risk – is quite compelling.
How To Calculate Beta
The formula to calculate a security’s Beta is fairly straightforward. The result, expressed as a number, shows the security’s tendency to move with the benchmark.
For example, a Beta value of 1.0 means that the security in question should move in lockstep with the benchmark. A Beta of 2.0 means that moves in the security should be twice as large in magnitude as the benchmark and in the same direction, while a negative Beta means that movements in the security and benchmark tend to move in opposite directions or are negatively correlated.
Related: The S&P 500 Stock With Negative Beta.
In other words, negatively correlated securities would be expected to rise when the overall market falls, or vice versa. A small value of Beta (something less than 1.0) indicates a stock that moves in the same direction as the benchmark, but with smaller relative changes.
Here’s a look at the formula:
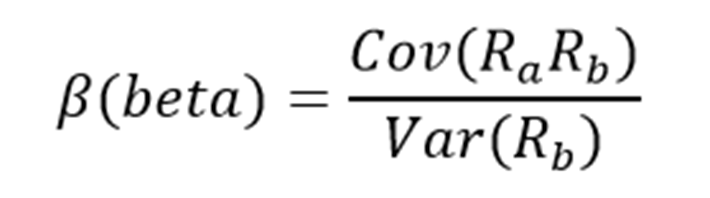
The numerator is the covariance of the asset in question with the market, while the denominator is the variance of the market. These complicated-sounding variables aren’t actually that difficult to compute – especially in Excel.
Additionally, Beta can also be calculated as the correlation coefficient of the security in question and the market, multiplied by the security’s standard deviation divided by the market’s standard deviation.
Finally, there’s a greatly simplified way to calculate Beta by manipulating the capital asset pricing model formula (more on Beta and the capital asset pricing model later in this article).
Here’s an example of the data you’ll need to calculate Beta:
Risk-free rate (typically Treasuries at least two years out)
Your asset’s rate of return over some period (typically one year to five years)
Your benchmark’s rate of return over the same period as the asset
To show how to use these variables to do the calculation of Beta, we’ll assume a risk-free rate of 2%, our stock’s rate of return of 7% and the benchmark’s rate of return of 8%.
You start by subtracting the risk-free rate of return from both the security in question and the benchmark. In this case, our asset’s rate of return net of the risk-free rate would be 5% (7% – 2%).
The same calculation for the benchmark would yield 6% (8% – 2%).
These two numbers – 5% and 6%, respectively – are the numerator and denominator for the Beta formula. Five divided by six yields a value of 0.83, and that is the Beta for this hypothetical security.
On average, we’d expect an asset with this Beta value to be 83% as volatile as the benchmark.
Thinking about it another way, this asset should be about 17% less volatile than the benchmark while still having its expected returns correlated in the same direction.
Beta & The Capital Asset Pricing Model (CAPM)
The Capital Asset Pricing Model, or CAPM, is a common investing formula that utilizes the Beta calculation to account for the time value of money as well as the risk-adjusted returns expected for a particular asset.
Beta is an essential component of the CAPM because without it, riskier securities would appear more favorable to prospective investors. Their risk wouldn’t be accounted for in the calculation.
The CAPM formula is as follows:

The variables are defined as:
ERi = Expected return of investment
Rf = Risk-free rate
βi = Beta of the investment
ERm = Expected return of market
The risk-free rate is the same as in the Beta formula, while the Beta that you’ve already calculated is simply placed into the CAPM formula. The expected return of the market (or benchmark) is placed into the parentheses with the market risk premium, which is also from the Beta formula. This is the expected benchmark’s return minus the risk-free rate.
To continue our example, here is how the CAPM actually works:
ER = 2% + 0.83(8% – 2%)
In this case, our security has an expected return of 6.98% against an expected benchmark return of 8%. That may be okay depending upon the investor’s goals as the security in question should experience less volatility than the market thanks to its Beta of less than 1.
While the CAPM certainly isn’t perfect, it is relatively easy to calculate and gives investors a means of comparison between two investment alternatives.
Now, we’ll take a look at five stocks that not only offer investors low Beta scores, but attractive prospective returns as well.
Analysis On The Top 5 Low Beta Stocks
The following 5 low beta stocks have the lowest Beta values, in ascending order from highest to lowest, that we currently cover in the Sure Analysis Research Database.
They also pay dividends to shareholders. Beta values provided by Finviz.
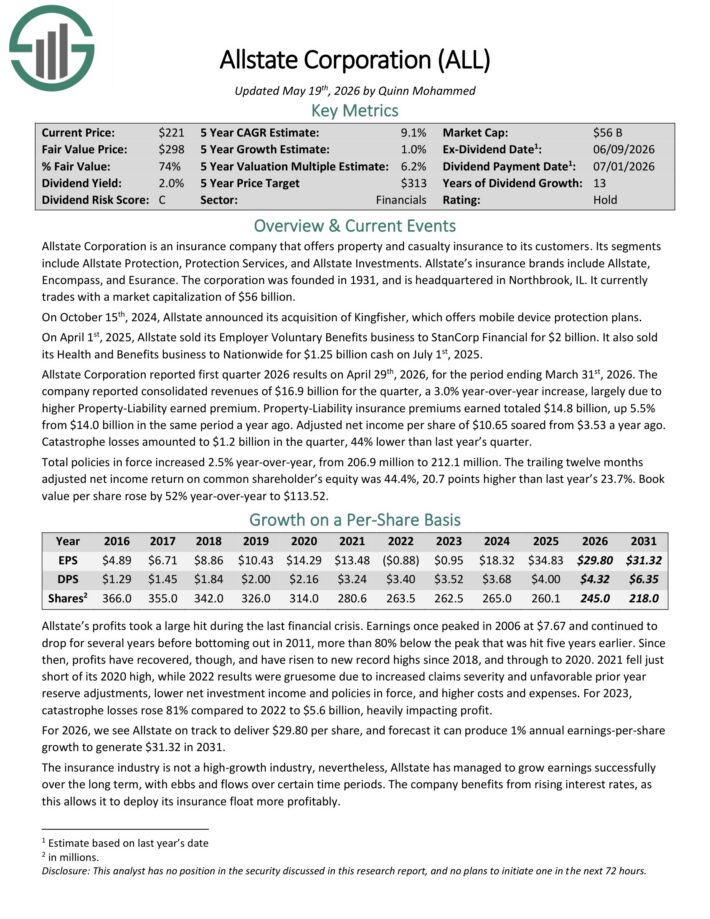
5. Allstate Corporation (ALL)
Allstate Corporation is an insurance company that offers property and casualty insurance to its customers. Its segmentsinclude Allstate Protection, Protection Services, and Allstate Investments.
Allstate’s insurance brands include Allstate, Encompass, and Esurance. The corporation was founded in 1931, and is headquartered in Northbrook, IL.
Allstate Corporation reported first quarter 2026 results on April 29th, 2026. The company reported consolidated revenues of $16.9 billion for the quarter, a 3.0% year-over-year increase, largely due to higher Property-Liability earned premium.
Property-Liability insurance premiums earned totaled $14.8 billion, up 5.5% from $14.0 billion in the same period a year ago.
Adjusted net income per share of $10.65 soared from $3.53 a year ago.
Catastrophe losses amounted to $1.2 billion in the quarter, 44% lower than last year’s quarter.
Click here to download our most recent Sure Analysis report on ALL (preview of page 1 of 3 shown below):
4. Exxon Mobil Corp. (XOM)
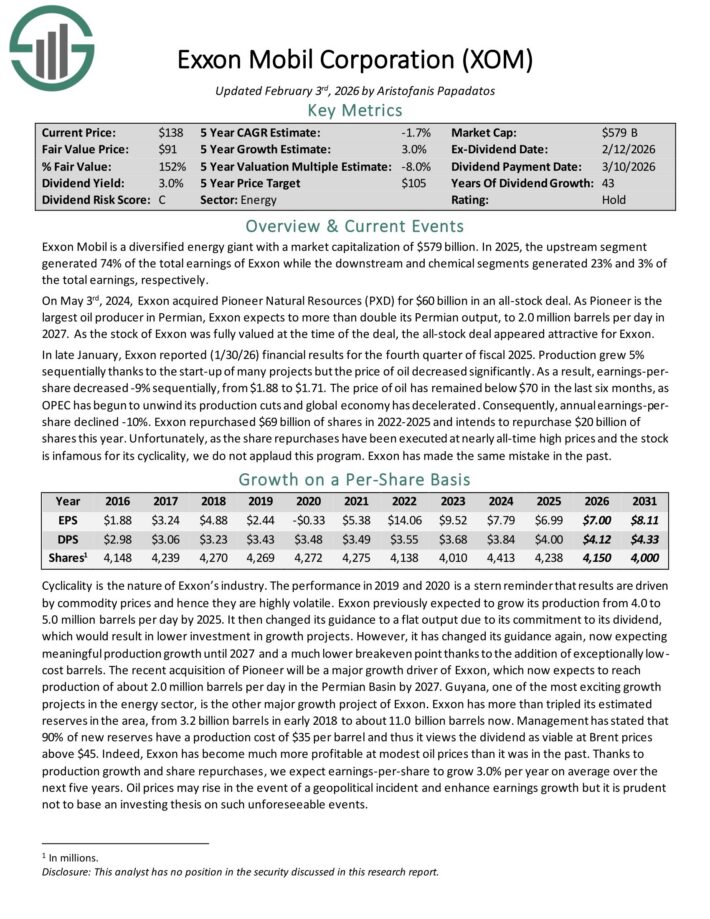
Exxon Mobil is a diversified energy giant with a market capitalization of $643 billion.
In 2025, the upstream segment generated 74% of the total earnings of Exxon while the downstream and chemical segments generated 23% and 3% of the total earnings, respectively.
In late January, Exxon reported (1/30/26) financial results for the fourth quarter of fiscal 2025. Production grew 5% sequentially thanks to the start-up of many projects but the price of oil decreased significantly.
As a result, earnings-per-share decreased -9% sequentially, from $1.88 to $1.71. The price of oil has remained below $70 in the last six months, as OPEC has begun to unwind its production cuts and global economy has decelerated.
Consequently, annual earnings-per-share declined -10%. Exxon repurchased $69 billion of shares in 2022-2025 and intends to repurchase $20 billion of shares this year.
Exxon is expecting meaningful production growth until 2027 and a much lower breakeven point thanks to the addition of exceptionally low-cost barrels.
The recent acquisition of Pioneer will be a major growth driver of Exxon, which now expects to reach production of about 2.0 million barrels per day in the Permian Basin by 2027.
Guyana, one of the most exciting growth projects in the energy sector, is the other major growth project of Exxon. Exxon has more than tripled its estimated reserves in the area, from 3.2 billion barrels in early 2018 to about 11.0 billion barrels now.
Click here to download our most recent Sure Analysis report on XOM (preview of page 1 of 3 shown below):
3. ConocoPhillips (COP)
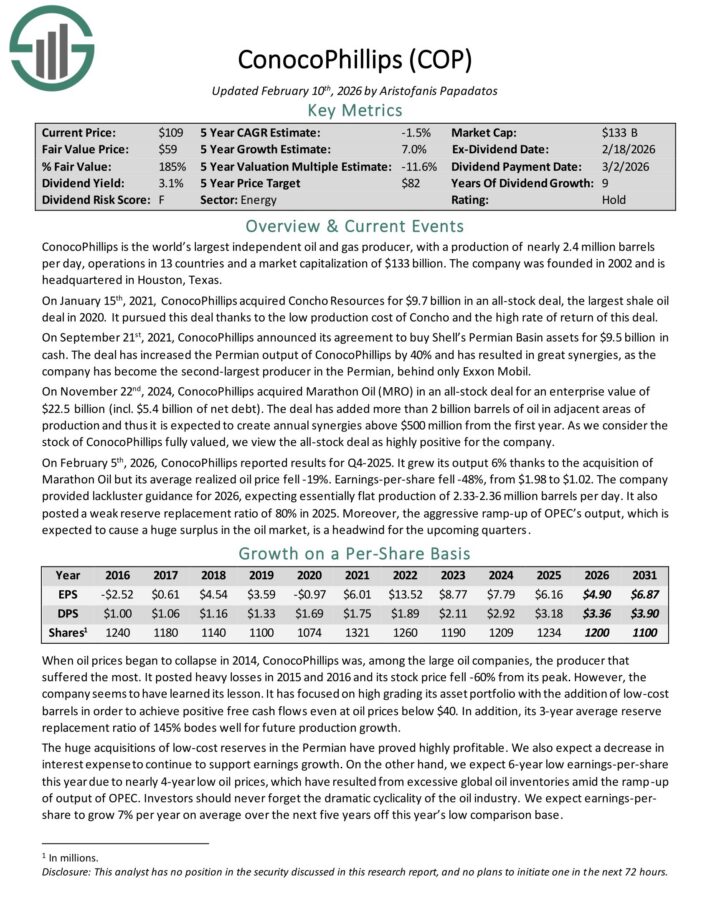
ConocoPhillips is the world’s largest independent oil and gas producer, with a production of nearly 2.4 million barrels per day, operations in 13 countries and a market capitalization of $144 billion.
On February 5th, 2026, ConocoPhillips reported results for Q4-2025. It grew its output 6% thanks to the acquisition of Marathon Oil but its average realized oil price fell -19%. Earnings-per-share fell -48%, from $1.98 to $1.02.
The company provided lackluster guidance for 2026, expecting essentially flat production of 2.33-2.36 million barrels per day. It also posted a weak reserve replacement ratio of 80% in 2025.
It has focused on high grading its asset portfolio with the addition of low-cost barrels in order to achieve positive free cash flows even at oil prices below $40.
In addition, its 3-year average reserve replacement ratio of 145% bodes well for future production growth.
The huge acquisitions of low-cost reserves in the Permian have proved highly profitable. We also expect a decrease in interest expense to continue to support earnings growth.
Click here to download our most recent Sure Analysis report on COP (preview of page 1 of 3 shown below):
2. Lockheed Martin (LMT)
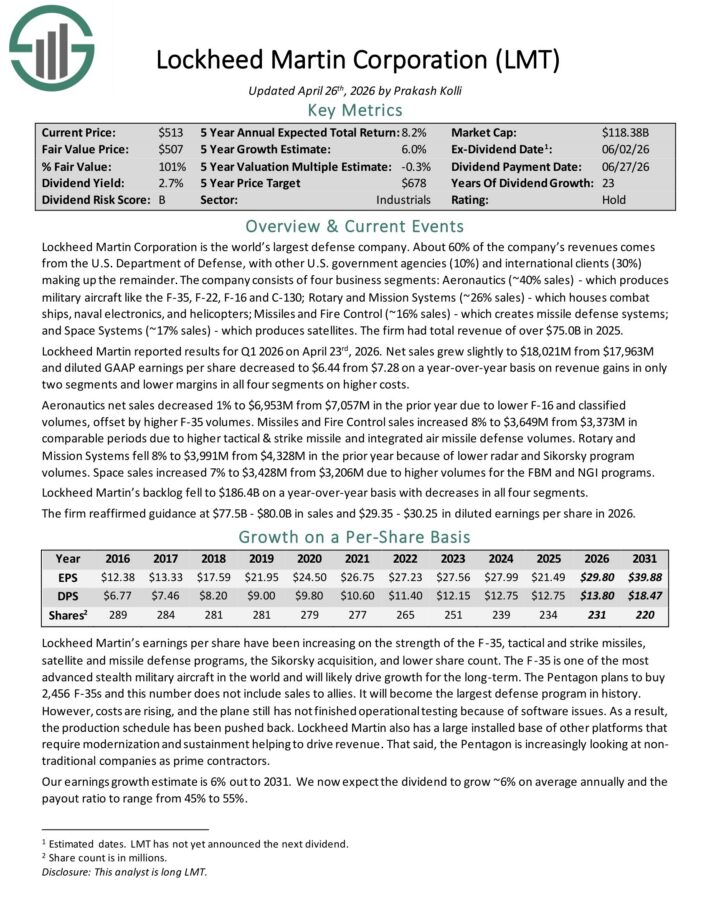
Lockheed Martin Corporation is the world’s largest defense company. About 60% of the company’s revenues comes from the U.S. Department of Defense, with other U.S. government agencies (10%) and international clients (30%) making up the remainder.
The company consists of four business segments: Aeronautics, which produces military aircraft like the F-35, F-22, F-16 and C-130; Rotary and Mission Systems, which houses combat ships, naval electronics, and helicopters; Missiles and Fire Control, which creates missile defense systems; and Space Systems, which produces satellites.
The firm had total revenue of over $75.0B in 2025.
Lockheed Martin reported results for Q1 2026 on April 23rd, 2026. Net sales grew slightly and diluted GAAP earnings per share decreased to $6.44 from $7.28 on a year-over-year basis .
Aeronautics net sales decreased 1% due to lower F-16 and classified volumes, offset by higher F-35 volumes.
Missiles and Fire Control sales increased 8% due to higher tactical & strike missile and integrated air missile defense volumes.
Rotary and Mission Systems fell 8% because of lower radar and Sikorsky program volumes. Space sales increased 7% due to higher volumes for the FBM and NGI programs.
Lockheed Martin’s backlog fell to $186.4B on a year-over-year basis with decreases in all four segments.
Click here to download our most recent Sure Analysis report on LMT (preview of page 1 of 3 shown below):
1. The Hershey Company (HSY)
The Hershey Company is a chocolate and sugar confectionary products manufacturer that sells brands such as Hershey’s, Reese’s, Kisses, Cadbury, Ice Breakers, Kit Kat, Almond Joy, Jolly Rancher, Twizzlers, Heath, and Milk Duds.
Hershey primarily operates in North America but has international operations as well. The company is headquartered in Hershey, PA.
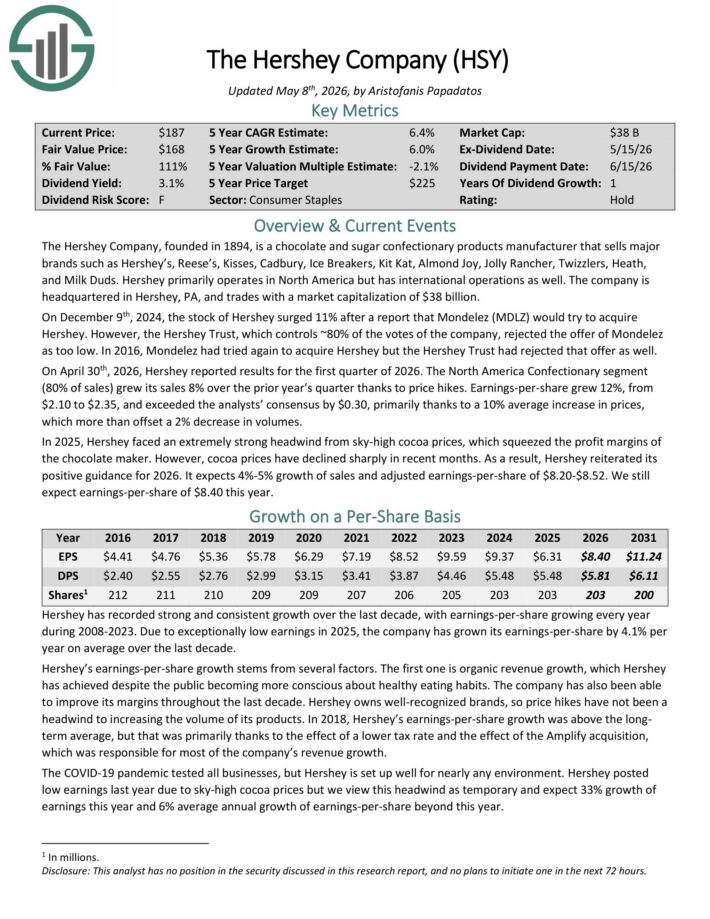
On April 30th, 2026, Hershey reported results for the first quarter of 2026. The North America Confectionary segment (80% of sales) grew its sales 8% over the prior year’s quarter thanks to price hikes.
Earnings-per-share grew 12%, from $2.10 to $2.35, and exceeded the analysts’ consensus by $0.30, primarily thanks to a 10% average increase in prices, which more than offset a 2% decrease in volumes.
In 2025, Hershey faced an extremely strong headwind from sky-high cocoa prices, which squeezed the profit margins of the chocolate maker. However, cocoa prices have declined sharply in recent months.
As a result, Hershey reiterated its positive guidance for 2026. It expects 4%-5% growth of sales and adjusted earnings-per-share of $8.20-$8.52.
Click here to download our most recent Sure Analysis report on HSY (preview of page 1 of 3 shown below):
Final Thoughts
Investors must take risk into account when selecting from prospective investments.
After all, if two securities are otherwise similar in terms of expected returns but one offers a much lower Beta, the investor would do well to select the low Beta security as they may offer better risk-adjusted returns.
Using Beta can help investors determine which securities will produce more volatility than the broader market and which ones may help diversify a portfolio, such as the ones listed here.
The five stocks we’ve looked at not only offer low Beta scores, but they also offer attractive dividend yields.
Sifting through the immense number of stocks available for purchase to investors using criteria like these can help investors find the best stocks to suit their needs.
Additional Reading
At Sure Dividend, we often advocate for investing in companies with a high probability of increasing their dividends each and every year.
If that strategy appeals to you, it may be useful to browse through the following databases of dividend growth stocks:
The Dividend Aristocrats List: dividend stocks with 25+ years of consecutive dividend increases
The Dividend Kings List is even more exclusive than the Dividend Aristocrats. It is comprised of 58 stocks with 50+ years of consecutive dividend increases.
The High Yield Dividend Kings List is comprised of the 20 Dividend Kings with the highest current yields.
The Blue Chip Stocks List: stocks that qualify as Dividend Achievers, Dividend Aristocrats, and/or Dividend Kings
The High Dividend Stocks List: stocks that appeal to investors interested in the highest yields of 5% or more.
The Monthly Dividend Stocks List: stocks that pay dividends every month, for 12 dividend payments per year.
The Dividend Champions List: stocks that have increased their dividends for 25+ consecutive years.Note: Not all Dividend Champions are Dividend Aristocrats because Dividend Aristocrats have additional requirements like being in The S&P 500.
Thanks for reading this article. Please send any feedback, corrections, or questions to [email protected].