Updated on July 7th, 2026 by Bob CiuraSpreadsheet data updated daily
The Dividend Kings are the best-of-the-best in dividend longevity.
What is a Dividend King? A stock with 50 or more consecutive years of dividend increases.
The downloadable Dividend Kings Spreadsheet List below contains the following for each stock in the index among other important investing metrics:
Payout ratio
Dividend yield
Price-to-earnings ratio
You can see the full downloadable spreadsheet of all 58 Dividend Kings (along with important financial metrics such as dividend yields, payout ratios, and price-to-earnings ratios) by clicking on the link below:
The Dividend Kings list includes recent additions such as Sonoco Products (SON), Pentair (PNR), and MGE Energy (MGEE).
Each Dividend King satisfies the primary requirement to be a Dividend Aristocrat (25 years of consecutive dividend increases) twice over.
Not all Dividend Kings are Dividend Aristocrats.
This unexpected result is because the ‘only’ requirement to be a Dividend Kings is 50+ years of rising dividends.
On the other hand, Dividend Aristocrats must have 25+ years of rising dividends, be a member of the S&P 500 Index, and meet certain minimum size and liquidity requirements.
Table of Contents
How To Use The Dividend Kings List to Find Dividend Stock Ideas
The Dividend Kings list is a great place to find dividend stock ideas. However, not all the stocks in the Dividend Kings list make a great investment at any given time.
Some stocks might be overvalued. Conversely, some might be undervalued – making great long-term holdings for dividend growth investors.
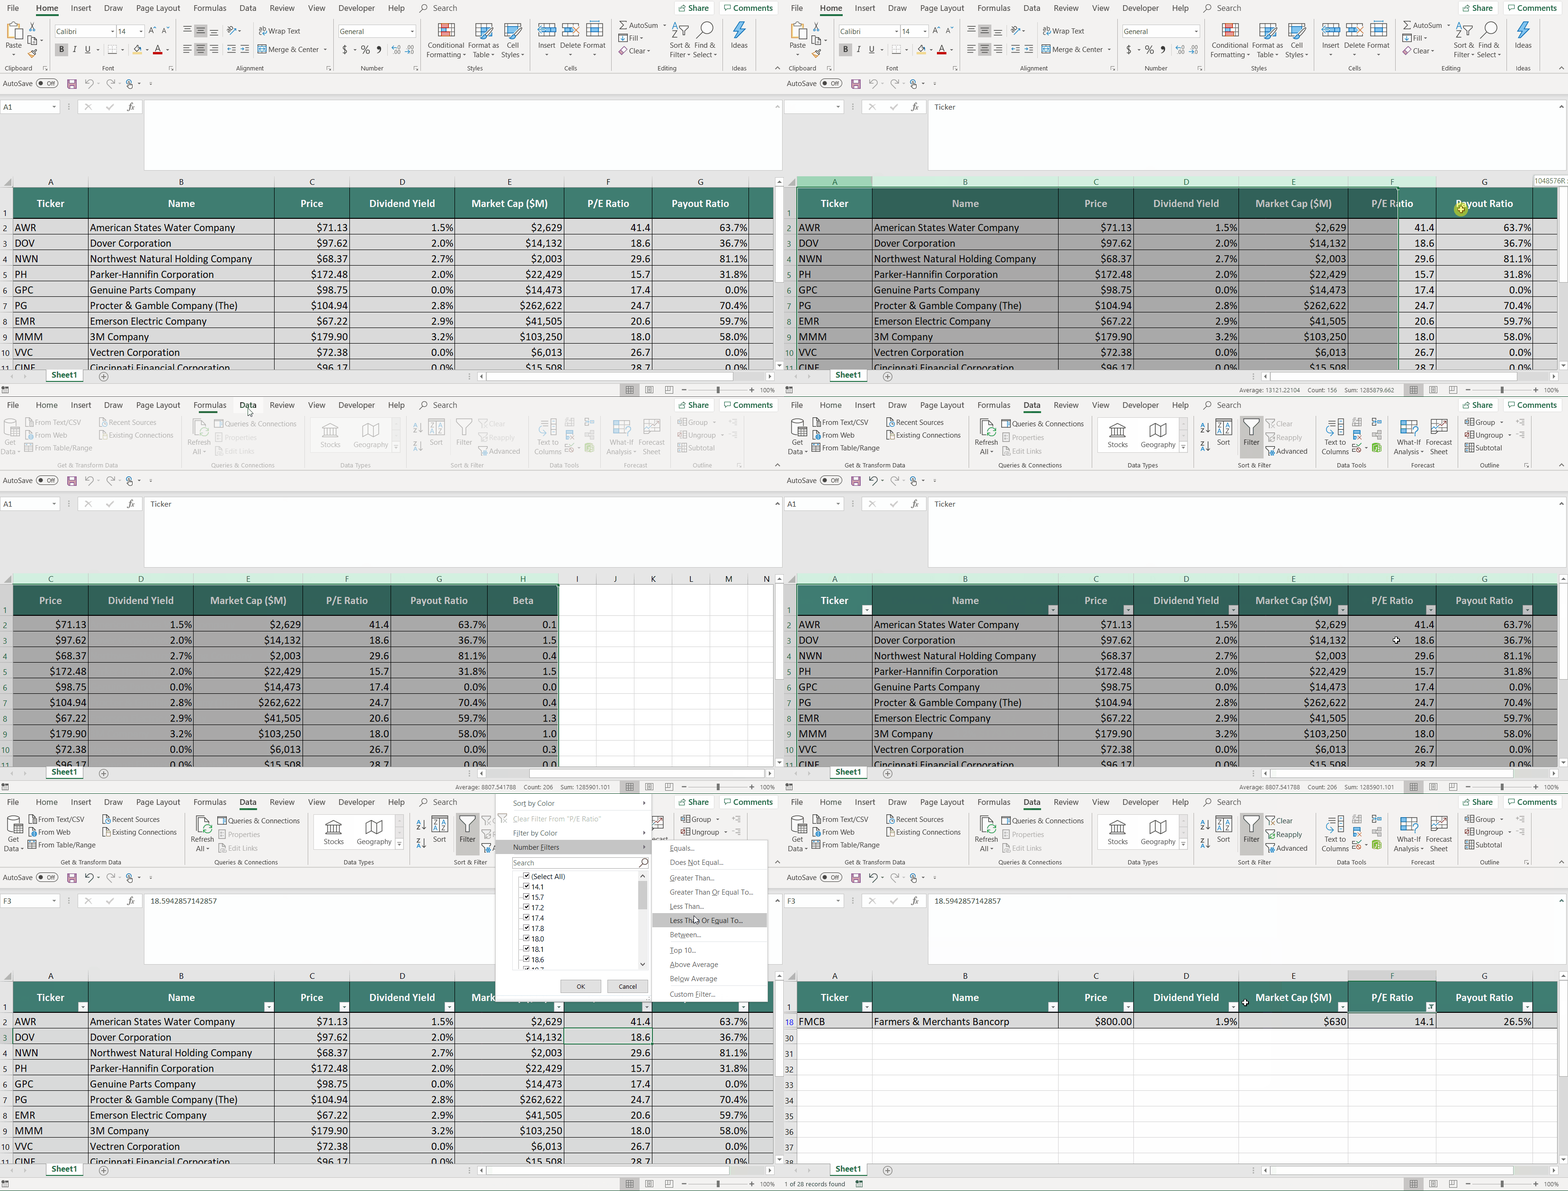
For those unfamiliar with Microsoft Excel, the following walk-through shows how to filter the Dividend Kings list for the stocks with the most attractive valuation based on the price-to-earnings ratio.
Step 1: Download the Dividend Kings Excel Spreadsheet.
Step 2: Follow the steps in the instructional video below. Note that we screen for price-to-earnings ratios of 15 or below in the video. You can choose any threshold that best defines ‘value’ for you.
Alternatively, following the instructions above and filtering for higher dividend yield Dividend Kings (yields of 2% or 3% or higher) will show stocks with 50+ years of rising dividends and above-average dividend yields.
Looking for businesses that have a long history of dividend increases isn’t a perfect way to identify stocks that will increase their dividends every year in the future, but there is considerable consistency in the Dividend Kings.
The 5 Best Dividend Kings Today
The following 5 stocks are our top-ranked Dividend Kings today, based on expected annual returns over the next 5 years. Stocks are ranked in order of lowest to highest expected annual returns.
Total returns include a combination of future earnings-per-share growth, dividends, and any changes in the P/E multiple.
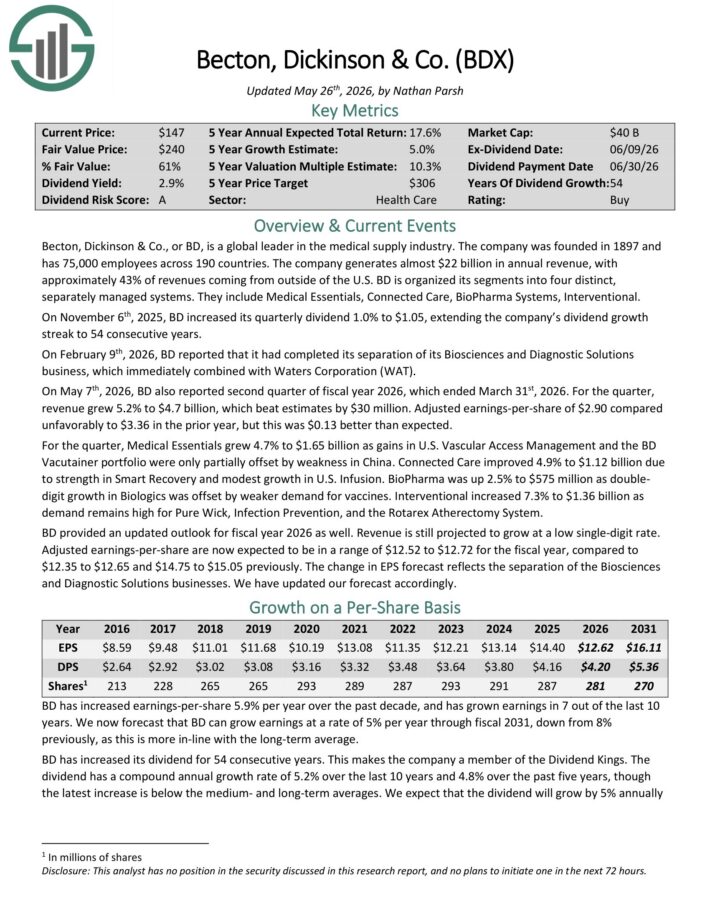
Dividend King #5: Becton, Dickinson & Co. (BDX)
5-Year Annual Expected Returns: 16.3%
Becton, Dickinson & Co. is a global leader in the medical supply industry. The company was founded in 1897 and has 75,000 employees across 190 countries.
The company generates about $20 billion in annual revenue, with approximately 43% of revenues coming from outside of the U.S.
On November 6th, 2025, BD increased its quarterly dividend 1.0% to $1.05, extending the company’s dividend growth streak to 54 consecutive years.
On May 7th, 2026, BDX also reported second quarter of fiscal year 2026, which ended March 31st, 2026. For the quarter, revenue grew 5.2% to $4.7 billion, which beat estimates by $30 million.
Adjusted earnings-per-share of $2.90 compared unfavorably to $3.36 in the prior year, but this was $0.13 better than expected.
Click here to download our most recent Sure Analysis report on BDX (preview of page 1 of 3 shown below):
Dividend King #4: PepsiCo Inc. (PEP)
5-Year Annual Expected Returns: 16.5%
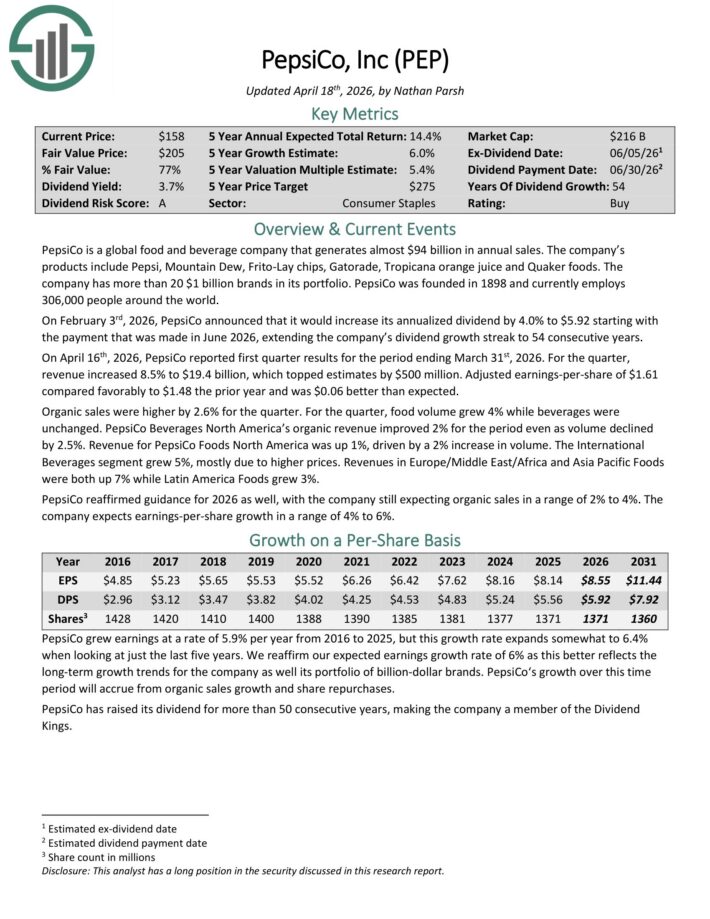
PepsiCo is a global food and beverage company that generates almost $94 billion in annual sales. The company’s products include Pepsi, Mountain Dew, Frito-Lay chips, Gatorade, Tropicana orange juice and Quaker foods.
The company has more than 20 $1 billion brands in its portfolio. PepsiCo was founded in 1898 and currently employs306,000 people around the world.
On February 3rd, 2026, PepsiCo increased its annualized dividend by 4.0% to $5.92 starting with the payment that was made in June 2026, extending the company’s dividend growth streak to 54 consecutive years.
On April 16th, 2026, PepsiCo reported first quarter results for the period ending March 31st, 2026. For the quarter, revenue increased 8.5% to $19.4 billion, which topped estimates by $500 million.
Adjusted earnings-per-share of $1.61 compared favorably to $1.48 the prior year and was $0.06 better than expected.
Organic sales were higher by 2.6% for the quarter. For the quarter, food volume grew 4% while beverages were unchanged.
PepsiCo Beverages North America’s organic revenue improved 2% for the period even as volume declined by 2.5%. Revenue for PepsiCo Foods North America was up 1%, driven by a 2% increase in volume.
The International Beverages segment grew 5%, mostly due to higher prices. Revenue in Europe/Middle East/Africa and Asia Pacific Foods were both up 7% while Latin America Foods grew 3%.
PepsiCo reaffirmed guidance for 2026 as well, with the company still expecting organic sales in a range of 2% to 4%. The company expects earnings-per-share growth in a range of 4% to 6%.
Click here to download our most recent Sure Analysis report on PEP (preview of page 1 of 3 shown below):
Dividend King #3: The Marzetti Company (MZTI)
5-Year Annual Expected Returns: 17.6%
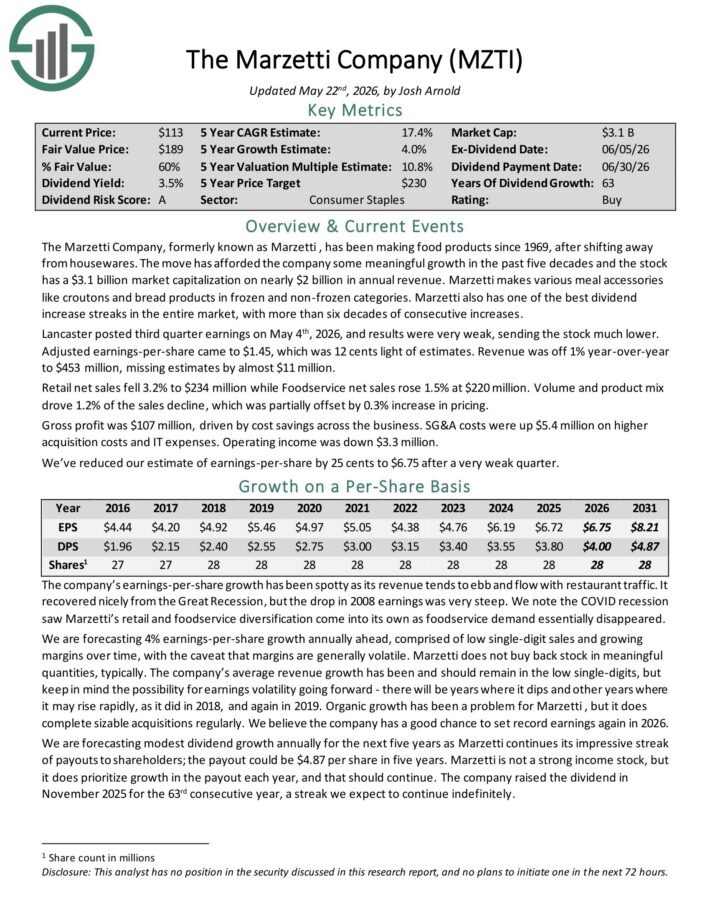
The Marzetti Company has been making food products since 1969. Marzetti makes various meal accessories like croutons and bread products in frozen and non-frozen categories.
Marzetti also has one of the best dividend increase streaks in the entire market, with more than six decades of consecutive increases.
Marzetti posted third quarter earnings on May 4th, 2026, and results were very weak. Adjusted earnings-per-share came to $1.45, which was 12 cents light of estimates.
Revenue was off 1% year-over-year to $453 million, missing estimates by almost $11 million.
Retail net sales fell 3.2% to $234 million while Foodservice net sales rose 1.5% at $220 million. Volume and product mix drove 1.2% of the sales decline, which was partially offset by 0.3% increase in pricing.
Gross profit was $107 million, driven by cost savings across the business. SG&A costs were up $5.4 million on higher acquisition costs and IT expenses. Operating income was down $3.3 million.
Click here to download our most recent Sure Analysis report on MZTI (preview of page 1 of 3 shown below):
Dividend King #2: Stepan Co. (SCL)
5-Year Annual Expected Returns: 19.1%
Stepan manufactures basic and intermediate chemicals, including surfactants, specialty products, germicidal and fabric softening quaternaries, phthalic anhydride, polyurethane polyols and special ingredients for the food, supplement, and pharmaceutical markets.
It is organized into three distinct business lines: surfactants, polymers, and specialty products. These businesses serve a wide variety of end markets, meaning that Stepan is not beholden to just a handful of industries.
The surfactants business is Stepan’s largest by revenue, accounting for ~68% of total sales in the most recent quarter. A surfactant is an organic compound that contains both water-soluble and water-insoluble components.
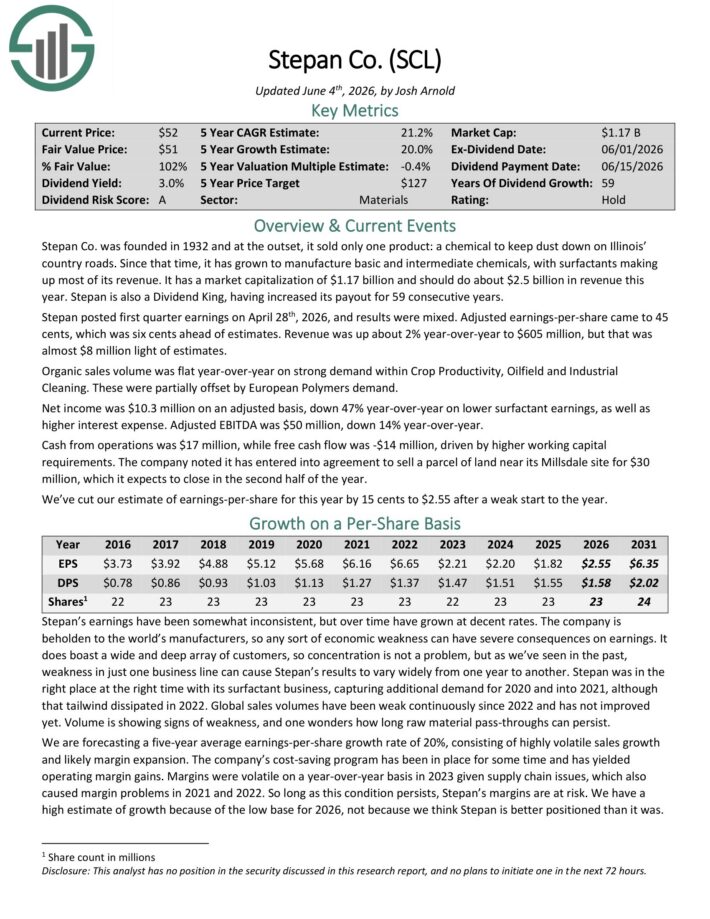
Stepan posted first quarter earnings on April 28th, 2026, and results were mixed. Adjusted earnings-per-share came to 45 cents, which was six cents ahead of estimates.
Revenue was up about 2% year-over-year to $605 million, but that was almost $8 million light of estimates.
Organic sales volume was flat year-over-year on strong demand within Crop Productivity, Oilfield and Industrial Cleaning. These were partially offset by European Polymers demand.
Net income was $10.3 million on an adjusted basis, down 47% year-over-year on lower surfactant earnings, as well as higher interest expense. Adjusted EBITDA was $50 million, down 14% year-over-year.
Cash from operations was $17 million, while free cash flow was -$14 million, driven by higher working capital requirements.
The company noted it has entered into agreement to sell a parcel of land near its Millsdale site for $30 million, which it expects to close in the second half of the year.
Click here to download our most recent Sure Analysis report on SCL (preview of page 1 of 3 shown below):
Dividend King #1: S&P Global (SPGI)
5-Year Annual Expected Returns: 19.8%
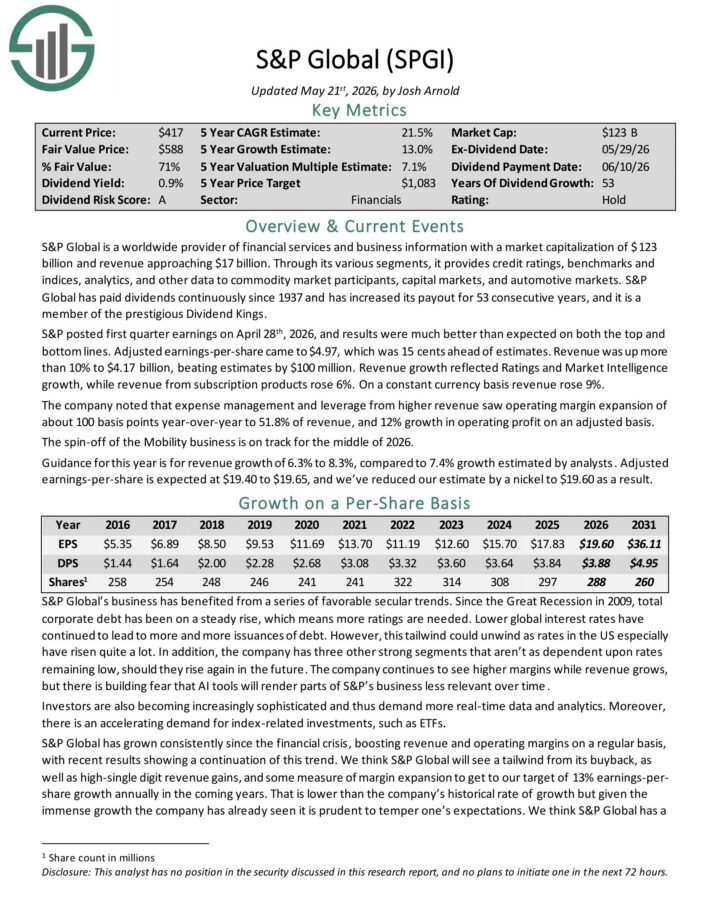
S&P Global is a worldwide provider of financial services and business information with revenue of about $16.5 billion.
Through its various segments, it provides credit ratings, benchmarks and indices, analytics, and other data to commodity market participants, capital markets, and automotive markets.
S&P Global has paid dividends continuously since 1937 and has increased its payout for 53 consecutive years.
S&P posted first quarter earnings on April 28th, 2026, and results were much better than expected on both the top and bottom lines. Adjusted earnings-per-share came to $4.97, which was 15 cents ahead of estimates.
Revenue was up more than 10% to $4.17 billion, beating estimates by $100 million. Revenue growth reflected Ratings and Market Intelligence growth, while revenue from subscription products rose 6%. On a constant currency basis revenue rose 9%.
The company noted that expense management and leverage from higher revenue saw operating margin expansion of about 100 basis points year-over-year to 51.8% of revenue, and 12% growth in operating profit on an adjusted basis.
The spin-off of the Mobility business is on track for the middle of 2026.
Guidance for this year is for revenue growth of 6.3% to 8.3%.
Click here to download our most recent Sure Analysis report on SPGI (preview of page 1 of 3 shown below):
The Dividend Kings In Focus Series
You can see analysis on every single Dividend King below. The newest Sure Analysis Research Database report for each security is included as well.
Consumer Staples
Industrials
Health Care
Consumer Discretionary
Financials
Materials
Energy
Real Estate
Utilities
Performance Of The Dividend Kings
The Dividend Kings out-performed the S&P 500 ETF (SPY) in June 2026. Return data for the month is shown below:
Dividend Kings monthly total return: 5.0%
SPY monthly total return: -1.0%
Stable dividend growers like the Dividend Kings tend to underperform in bull markets and outperform on a relative basis during bear markets.
The Dividend Kings are not officially regulated and monitored by any one company. There’s no Dividend King ETF. This means that tracking the historical performance of the Dividend Kings can be difficult.
More specifically, performance tracking of the Dividend Kings often introduces significant survivorship bias.
Survivorship bias occurs when one looks at only the companies that ‘survived’ the time period in question. In the case of Dividend Kings, this means that the performance study does not include ex-Kings that reduced their dividend, were acquired, etc.
But with that said, there is something to be gained from investigating the historical performance of the Dividend Kings. Specifically, the performance of the Dividend Kings shows that ‘boring’ established blue-chip stocks that increase their dividend year-after-year can significantly outperform over long periods of time.
Notes: S&P 500 performance is measured using the S&P 500 ETF (SPY). The Dividend Kings performance is calculated using an equal weighted portfolio of today’s Dividend Kings, rebalanced annually. Due to insufficient data, Farmers & Merchants Bancorp (FMCB) returns are from 2000 onward. Performance excludes previous Dividend Kings that ended their streak of dividend increases which creates notable lookback/survivorship bias. The data for this study is from Ycharts.
In the next section of this article, we will provide an overview of the sector and market capitalization characteristics of the Dividend Kings.
Sector & Market Capitalization Overview
The sector and market capitalization characteristics of the Dividend Kings are very different from the characteristics of the broader stock market.
The following bullet points show the number of Dividend Kings in each sector of the stock market.
Consumer Staples: 14
Industrials: 13
Utilities: 9
Consumer Discretionary: 2
Health Care: 5
Financials: 6
Materials: 5
Real Estate: 1
Energy: 1
Communication Services: 0
The Dividend Kings are overweight in the Industrials, Consumer Staples, and Utilities sectors. Interestingly, The Dividend Kings have zero stocks from the Information Technology sector, which is the largest component of the S&P 500 index.
The Dividend Kings also have some interesting characteristics with respect to market capitalization. These trends are illustrated below.
6 Mega caps ($200 billion+ market cap; ABT, ABBV, JNJ, PG, KO, WMT)
27 Large caps ($10 billion to $200 billion market cap)
17 Mid caps ($2 billion to $10 billion)
8 Small caps ($300 million to $2 billion)
Interestingly, 26 out of the 58 Dividend Kings have market capitalizations below $10 billion. This shows that corporate longevity doesn’t have to be accompanied by massive size.
Final Thoughts
Screening to find the best Dividend Kings is not the only way to find high-quality dividend growth stock ideas.
Sure Dividend maintains similar databases on the following useful universes of stocks:
There is nothing magical about investing in the Dividend Kings. They are simply a group of high-quality businesses with shareholder-friendly management teams that have strong competitive advantages.
Purchasing businesses with these characteristics at fair or better prices and holding them for long periods of time will likely result in strong long-term investment performance.
Thanks for reading this article. Please send any feedback, corrections, or questions to [email protected].