Updated on July 6th, 2026 by Bob CiuraSpreadsheet data updated daily
Monthly dividend stocks are securities that pay a dividend every month instead of quarterly or annually.
This research report focuses on all 121 individual monthly paying securities. It includes the following resources.
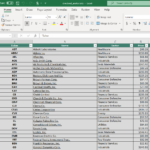
Resource #1: The Monthly Dividend Stock Spreadsheet List

This list contains important metrics, including: dividend yields, payout ratios, dividend growth rates, 52-week highs and lows, and more.
Note: We strive to maintain an accurate list of all monthly dividend payers. There’s no universal source we are aware of for monthly dividend stocks; we curate this list manually. If you know of any stocks that pay monthly dividends that are not on our list, please email [email protected].
Resource #2: The Monthly Dividend Stocks In Focus SeriesThe Monthly Dividend Stocks In Focus series is where we analyze all monthly paying dividend stocks. This resource links to stand-alone analysis on each of these securities.
Resource #3: The 10 Best Monthly Dividend StocksThis research report analyzes the 10 best monthly dividend stocks as ranked by expected total return.
Resource #4: Other Monthly Dividend Stock Research– Why monthly dividends matter– The dangers of investing in monthly dividend stocks– Final thoughts and other income investing resources
The Monthly Dividend Stocks In Focus Series
You can see detailed analysis on the individual monthly dividend securities we cover by clicking the links below:
Agree Realty (ADC)
AGNC Investment (AGNC)
Atrium Mortgage Investment Corporation (AMIVF)
Apple Hospitality REIT, Inc. (APLE)
Automotive Properties Real Estate Investment Trust (APPTF)
Allied Properties Real Estate Investment Trust (APYRF)
ARMOUR Residential REIT (ARR)
Banco BBVA Argentina S.A. (BBAR)
Banco Bradesco S.A. (BBD)
BCP Investment Corp. (BCIC)
Diversified Royalty Corp. (BEVFF)
Bird Construction (BIRDF)
Banco Macro S.A. (BMA)
Boardwalk Real Estate Investment Trust (BOWFF)
Boston Pizza Royalties Income Fund (BPZZF)
Bridgemarq Real Estate Services (BREUF)
BSR Real Estate Investment Trust (BSRTF)
BTB Real Estate Investment Trust (BTBIF)
Canadian Apartment Properties REIT (CDPYF)
Cardinal Energy Ltd. (CRLFF)
ChemTrade Logistics Income Fund (CGIFF)
CION Investment Corporation (CION)
Canadian Net REIT (CNNRF)
Chiron Real Estate (XRN)
Choice Properties REIT (PPRQF)
Crombie Real Estate Investment Trust (CROMF)
Cross Timbers Royalty Trust (CRT)
Capital Southwest Corp. (CSWC)
CT Real Estate Investment Trust (CTRRF)
Chartwell Retirement Residences (CWSRF)
SmartCentres Real Estate Investment Trust (CWYUF)
Decisive Dividend Corp. (DEDVF)
Dynacor Group Inc (DNGDF)
Dream Office REIT (DRETF)
Dream Industrial REIT (DREUF)
Dynex Capital (DX)
Ellington Residential Mortgage REIT (EARN)
Ellington Financial (EFC)
Nexus Industrial REIT (EFRTF)
EPR Properties (EPR)
Exchange Income (EIFZF)
Extendicare Inc. (EXETF)
Flagship Communities REIT (MHCUF)
Four Corners REIT (FCPT)
Freehold Royalties Ltd. (FRHLF)
Firm Capital Mortgage Investment Trust (FCMGF)
First Capital Real Estate Investment Trust (FCXXF)
Firm Capital Property Trust (FRMUF)
Fortitude Gold (FTCO)
Gladstone Capital Corporation (GLAD)
Gladstone Commercial Corporation (GOOD)
Gladstone Investment Corporation (GAIN)
Gladstone Land Corporation (LAND)
Global Water Resources (GWRS)
Granite Real Estate Investment Trust (GRTUF)
Grupo Aval Acciones y Valores S.A. (AVAL)
Grupo Financiero Galicia S.A. (GGAL)
Gamehost Inc. (GHIFF)
GO Residential REIT (GONYF)
Healthpeak Properties (DOC)
H&R Real Estate Investment Trust (HRUFF)
Horizon Technology Finance (HRZN)
Himalaya Shipping Ltd. (HSHP)
InPlay Oil Corp. (IPOOF)
Itaú Unibanco (ITUB)
Invesco Mortgage Capital (IVR)
K-Bro Linen Inc. (KBRLF)
Killam Apartment REIT (KMMPF)
LTC Properties (LTC)
Sienna Senior Living (LWSCF)
Main Street Capital (MAIN)
Mesa Royalty Trust (MTR)
Modiv Inc. (MDV)
Morguard Real Estate Investment Trust (MGRUF)
Flagship Communities REIT (MHCUF)
Minto Apartment REIT (MIAPF)
Mullen Group Ltd. (MLLGF)
Morguard North American REIT (MNARF)
MSC Income Fund (MSIF)
Northland Power Inc. (NPIFF)
Northview Residential REIT (NRRUF)
Olympia Financial Group (OLYFF)
Orchid Island Capital (ORC)
Oxford Square Capital (OXSQ)
Plaza Retail REIT (PAZRF)
Permian Basin Royalty Trust (PBT)
Phillips Edison & Company (PECO)
Pennant Park Floating Rate (PFLT)
Peyto Exploration & Development Corp. (PEYUF)
Pine Cliff Energy Ltd. (PIFYF)
Primaris REIT (PMREF)
PennantPark Investment Corporation (PNNT)
Paramount Resources Ltd. (PRMRF)
PermRock Royalty Trust (PRT)
Pro Real Estate Investment Trust (PRVFF)
Prospect Capital Corporation (PSEC)
Petrus Resources Ltd. (PTRUF)
Permianville Royalty Trust (PVL)
Pizza Pizza Royalty Corp. (PZRIF)
Realty Income (O)
Richards Group Inc. (RPKIF)
RioCan Real Estate Investment Trust (RIOCF)
Saratoga Invesmtent Corp. (SAR)
Sabine Royalty Trust (SBR)
Stellus Capital Investment Corp. (SCM)
Savaria Corp. (SISXF)
San Juan Basin Royalty Trust (SJT)
Sir Royalty Income Fund (SIRZF)
SmartStop Self Storage REIT (SMA)
Source Rock Royalties Ltd. (SRRRF)
Slate Grocery REIT (SRRTF)
Stag Industrial (STAG)
Surge Energy Inc. (ZPTAF)
Timbercreek Financial Corp. (TBCRF)
Trinity Capital (TRIN)
True North Commercial REIT (TUERF)
Telefonica Brasil S.A. (VIV)
UDR, Inc. (UDR)
U.S. Global Investors (GROW)
Vital Industries Property Trust (NWHUF)
Whitecap Resources Inc. (WCPRF)
The 10 Best Monthly Dividend Stocks
This research report examines the 10 monthly dividend stocks from our Sure Analysis Research Database with the highest 5-year forward expected total returns.
We currently cover almost all monthly dividend stocks every quarter in the Sure Analysis Research Database.
Use the table below to quickly jump to analysis on any of the top 10 best monthly dividend stocks as ranked by expected total returns.
Table of Contents
You can instantly jump to any specific section of the article by using the links below:
Monthly Dividend Stock #10: Itau Unibanco (ITUB)
5-Year Expected Total Return: 13.2%
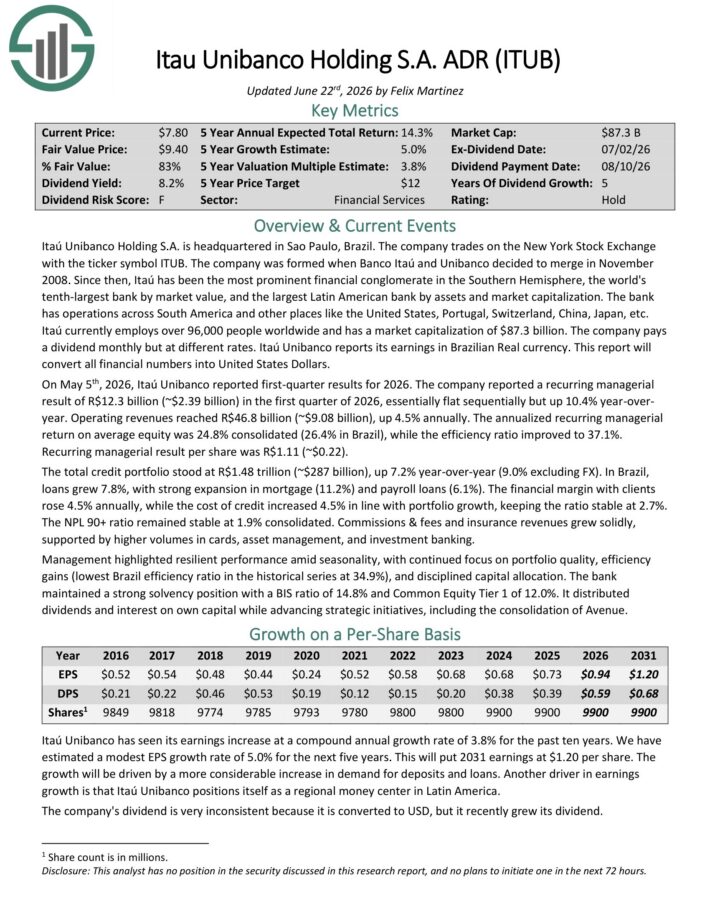
Itaú Unibanco Holding S.A. is headquartered in Sao Paulo, Brazil. Itaú has been the most prominent financial conglomerate in the Southern Hemisphere, the world’s tenth-largest bank by market value, and the largest Latin American bank by assets and market capitalization.
On May 5th, 2026, Itaú Unibanco reported first-quarter results for 2026. The company reported a recurring managerial result of R$12.3 billion (~$2.39 billion) in the first quarter of 2026, essentially flat sequentially but up 10.4% year-over-year.
Operating revenues reached R$46.8 billion (~$9.08 billion), up 4.5% annually. The annualized recurring managerial return on average equity was 24.8% consolidated (26.4% in Brazil), while the efficiency ratio improved to 37.1%.
Recurring managerial result per share was R$1.11 (~$0.22). The total credit portfolio stood at R$1.48 trillion (~$287 billion), up 7.2% year-over-year (9.0% excluding FX).
The NPL 90+ ratio remained stable at 1.9% consolidated. Commissions & fees and insurance revenues grew solidly, supported by higher volumes in cards, asset management, and investment banking.
Click here to download our most recent Sure Analysis report on ITUB (preview of page 1 of 3 shown below):
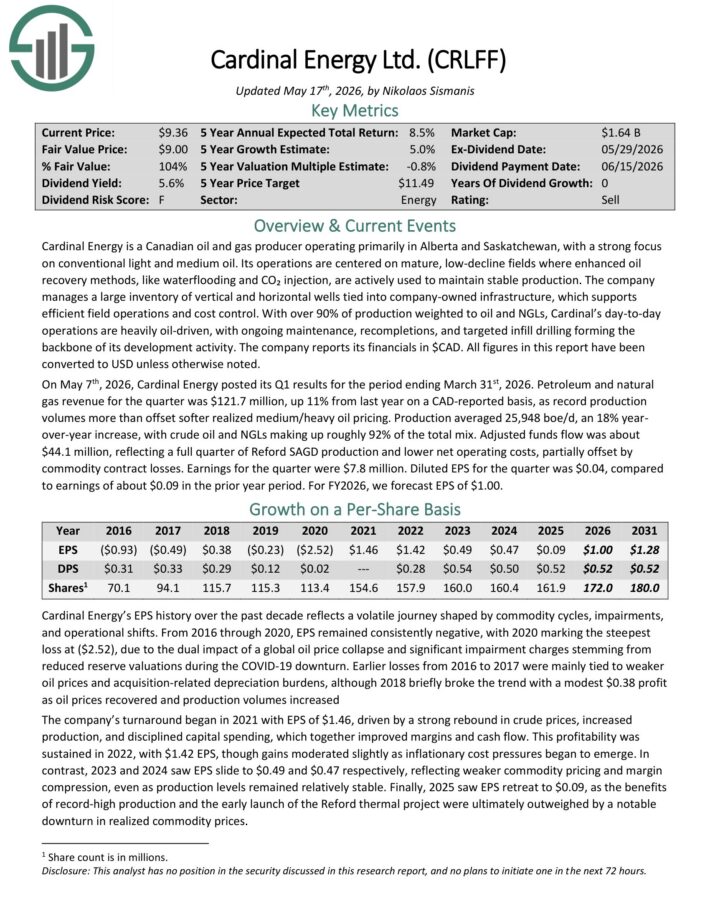
Monthly Dividend Stock #9: Cardinal Energy (CRLFF)
5-Year Expected Total Return: 13.5%
Cardinal Energy is a Canadian oil and gas producer operating primarily in Alberta and Saskatchewan, with a strong focus on conventional light and medium oil.
Its operations are centered on mature, low-decline fields where enhanced oil recovery methods, like waterflooding and CO₂ injection, are actively used to maintain stable production.
The company manages a large inventory of vertical and horizontal wells tied into company-owned infrastructure, which supports efficient field operations and cost control.
With over 90% of production weighted to oil and NGLs, Cardinal’s day-to-day operations are heavily oil-driven, with ongoing maintenance, recompletions, and targeted infill drilling forming the backbone of its development activity.
On May 7th, 2026, Cardinal Energy posted its Q1 results. Petroleum and natural gas revenue for the quarter was $121.7 million, up 11% from last year on a CAD-reported basis, as record production volumes more than offset softer realized medium/heavy oil pricing.
Production averaged 25,948 boe/d, an 18% year-over-year increase, with crude oil and NGLs making up roughly 92% of the total mix.
Adjusted funds flow was about $44.1 million, reflecting a full quarter of Reford SAGD production and lower net operating costs, partially offset by commodity contract losses.
Earnings for the quarter were $7.8 million. Diluted EPS for the quarter was $0.04, compared to earnings of about $0.09 in the prior year period.
Click here to download our most recent Sure Analysis report on CRLFF (preview of page 1 of 3 shown below):
Monthly Dividend Stock #8: True North Commercial REIT (TUERF)
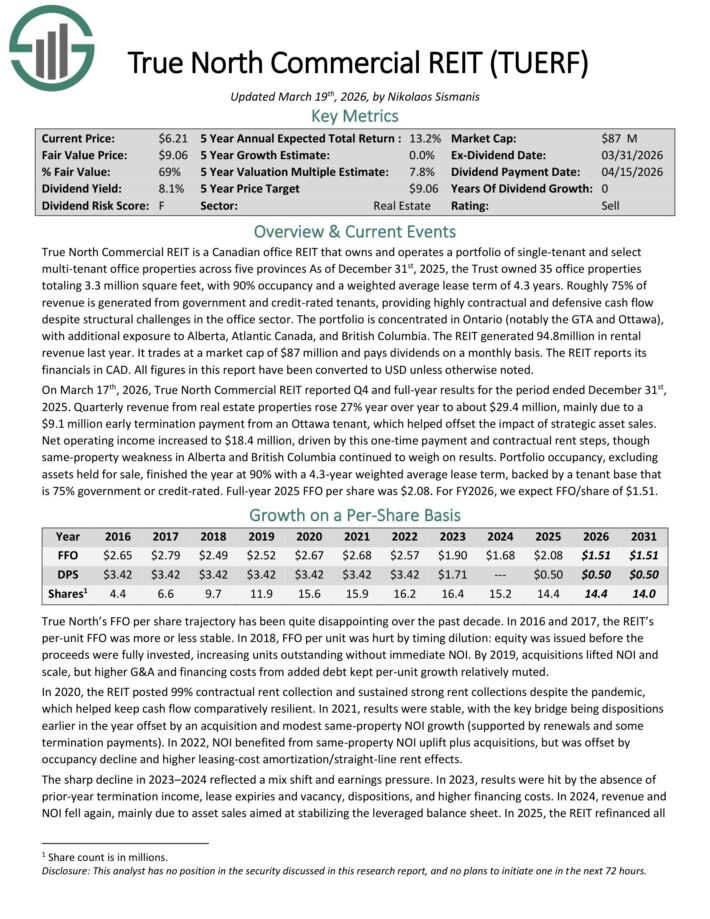
5-Year Expected Total Return: 14.1%
True North Commercial REIT is a Canadian office REIT that owns and operates a portfolio of single-tenant and select multi-tenant office properties across five provinces.
As of December 31st, 2025, the Trust owned 35 office properties totaling 3.3 million square feet, with 90% occupancy and a weighted average lease term of 4.3 years.
Roughly 75% of revenue is generated from government and credit-rated tenants, providing highly contractual and defensive cash flow despite structural challenges in the office sector.
The portfolio is concentrated in Ontario (notably the GTA and Ottawa), with additional exposure to Alberta, Atlantic Canada, and British Columbia.
On March 17th, 2026, True North Commercial REIT reported Q4 and full-year results for the period ended December 31st, 2025. Quarterly revenue from real estate properties rose 27% year over year to about $29.4 million, mainly due to a $9.1 million early termination payment from an Ottawa tenant, which helped offset the impact of strategic asset sales.
Net operating income increased to $18.4 million, driven by this one-time payment and contractual rent steps, though same-property weakness in Alberta and British Columbia continued to weigh on results.
Portfolio occupancy, excluding assets held for sale, finished the year at 90% with a 4.3-year weighted average lease term, backed by a tenant base that is 75% government or credit-rated.
Full-year 2025 FFO per share was $2.08. For FY2026, we expect FFO/share of $1.51.
Click here to download our most recent Sure Analysis report on TUERF (preview of page 1 of 3 shown below):
Monthly Dividend Stock #7: Saratoga Investment Corp. (SAR)
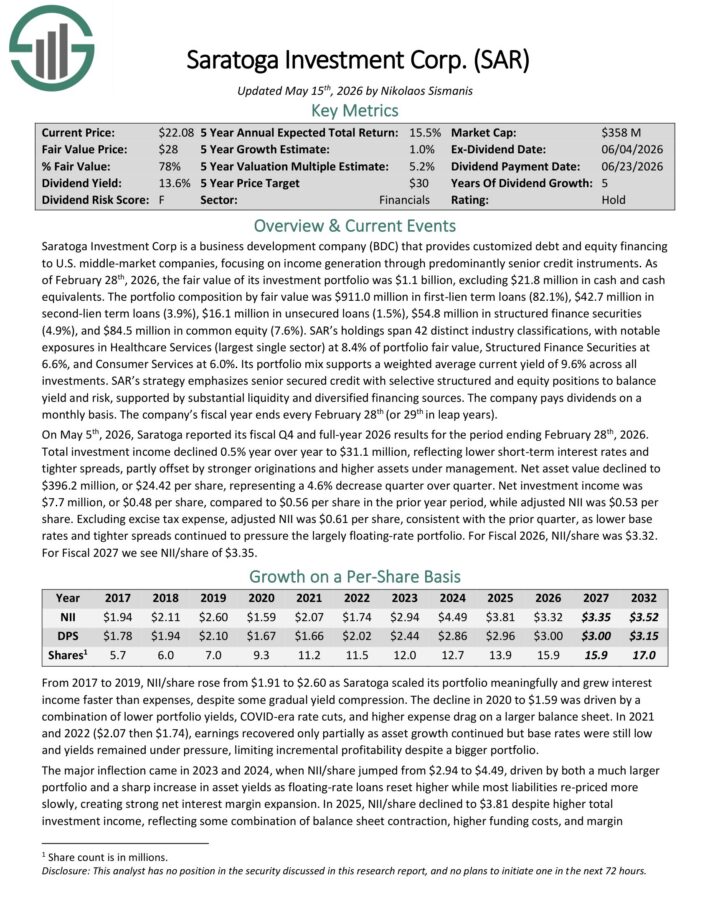
5-Year Expected Total Return: 14.9%
Saratoga Investment Corp is a BDC that provides customized debt and equity financing to U.S. middle-market companies, focusing on income generation through predominantly senior credit instruments.
As of February 28th, 2026, the fair value of its investment portfolio was $1.1 billion, excluding $21.8 million in cash and cash equivalents.
The portfolio composition by fair value was $911.0 million in first-lien term loans (82.1%), $42.7 million in second-lien term loans (3.9%), $16.1 million in unsecured loans (1.5%), $54.8 million in structured finance securities (4.9%), and $84.5 million in common equity (7.6%).
SAR’s holdings span 39 distinct industry classifications, with notable exposures in Healthcare Services (largest single sector) at 9.7% of portfolio fair value, Structured Finance Securities at 7.3%, and Consumer Services at 6.0%.
On May 5th, 2026, Saratoga reported its fiscal Q4 and full-year 2026 results. Total investment income declined 0.5% year over year to $31.1 million, reflecting lower short-term interest rates and tighter spreads, partly offset by stronger originations and higher assets under management.
Net asset value declined to $396.2 million, or $24.42 per share, representing a 4.6% decrease quarter over quarter. Net investment income was $7.7 million, or $0.48 per share, compared to $0.56 per share in the prior year period, while adjusted NII was $0.53 per share.
Click here to download our most recent Sure Analysis report on SAR (preview of page 1 of 3 shown below):
Monthly Dividend Stock #6: PennantPark Floating Rate Capital (PFLT)
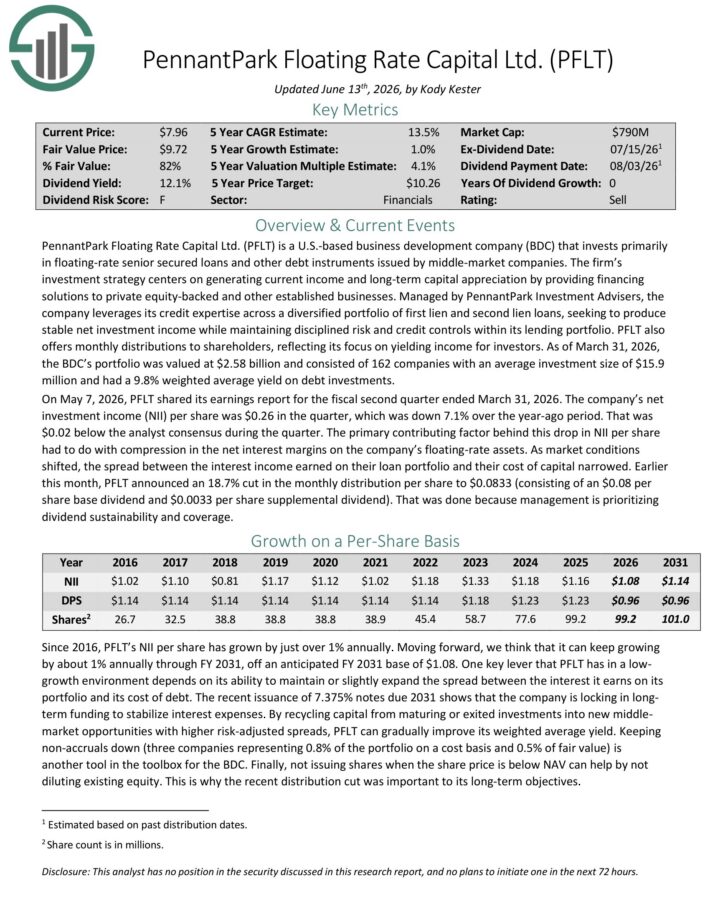
5-Year Expected Total Return: 15.0%
PennantPark Floating Rate Capital Ltd. is a business development company that seeks to make secondary direct, debt, equity, and loan investments.
The fund also aims to invest through floating rate loans in private or thinly traded or small market-cap, public middle market companies, equity securities, preferred stock, common stock, warrants or options received in connection with debt investments or through direct investments.
On May 7, 2026, PFLT shared its earnings report for the fiscal second quarter ended March 31, 2026. The company’s net investment income (NII) per share was $0.26 in the quarter, which was down 7.1% over the year-ago period. That was $0.02 below the analyst consensus during the quarter.
The primary contributing factor behind this drop in NII per share had to do with compression in the net interest margins on the company’s floating-rate assets. As market conditions shifted, the spread between the interest income earned on their loan portfolio and their cost of capital narrowed.
Earlier this month, PFLT announced an 18.7% cut in the monthly distribution per share to $0.0833 (consisting of an $0.08 per share base dividend and $0.0033 per share supplemental dividend).
Click here to download our most recent Sure Analysis report on PFLT (preview of page 1 of 3 shown below):
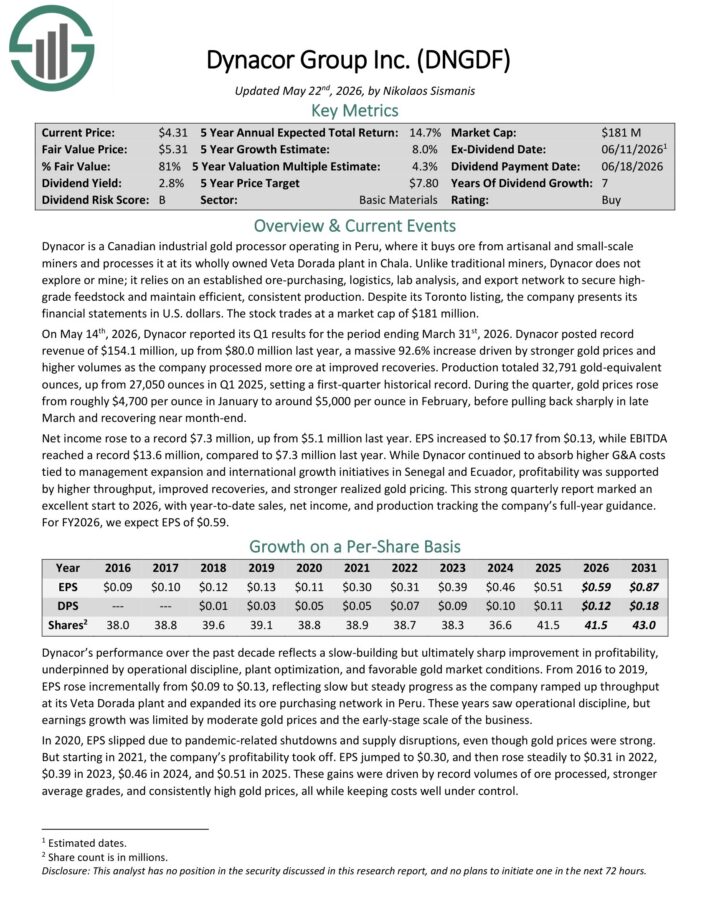
Monthly Dividend Stock #5: Dynacor Group (DNGDF)
5-Year Expected Total Return: 15.0%
Dynacor is a Canadian industrial gold processor operating in Peru, where it buys ore from artisanal and small-scale miners and processes it at its wholly owned Veta Dorada plant in Chala.
Unlike traditional miners, Dynacor does not explore or mine; it relies on an established ore-purchasing, logistics, lab analysis, and export network to secure high-grade feedstock and maintain efficient, consistent production.
On May 14th, 2026, Dynacor reported its Q1 results for the period ending March 31st, 2026. Dynacor posted record revenue of $154.1 million, up from $80.0 million last year, a massive 92.6% increase driven by stronger gold prices and higher volumes as the company processed more ore at improved recoveries.
Production totaled 32,791 gold-equivalent ounces, up from 27,050 ounces in Q1 2025, setting a first-quarter historical record. During the quarter, gold prices rose from roughly $4,700 per ounce in January to around $5,000 per ounce in February, before pulling back sharply in late March and recovering near month-end.
Net income rose to a record $7.3 million, up from $5.1 million last year. EPS increased to $0.17 from $0.13, while EBITDA reached a record $13.6 million, compared to $7.3 million last year.
While Dynacor continued to absorb higher G&A costs tied to management expansion and international growth initiatives in Senegal and Ecuador, profitability was supported by higher throughput, improved recoveries, and stronger realized gold pricing.
Click here to download our most recent Sure Analysis report on DNGDF (preview of page 1 of 3 shown below):
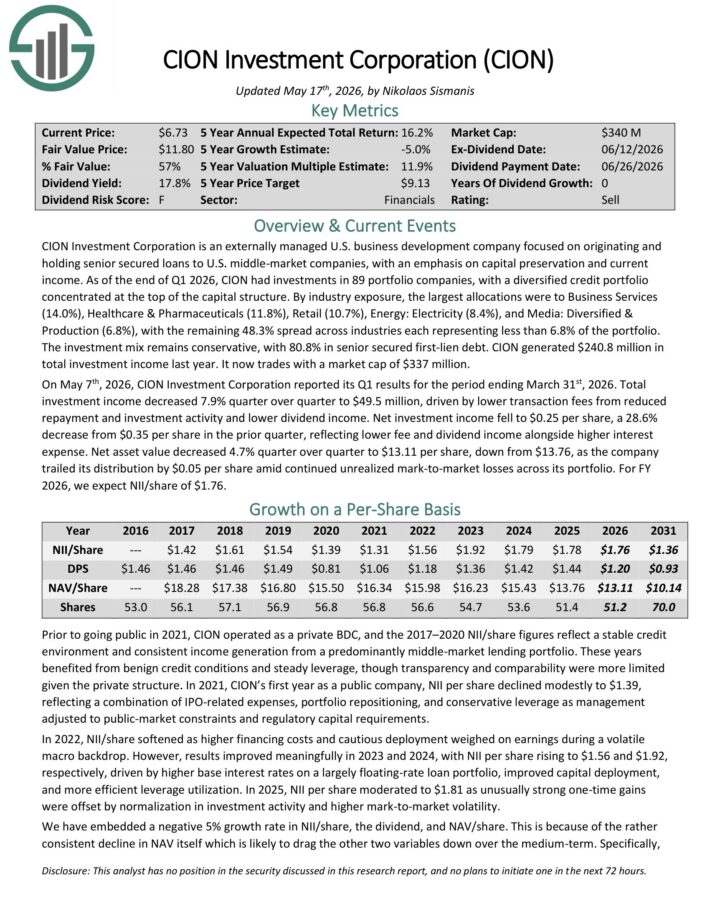
Monthly Dividend Stock #4: CION Investment Corporation (CION)
5-Year Expected Total Return: 17.5%
CION Investment Corporation is an externally managed U.S. business development company focused on originating and holding senior secured loans to U.S. middle-market companies, with an emphasis on capital preservation and current income.
As of the end of Q1 2026, CION had investments in 89 portfolio companies, with a diversified credit portfolio concentrated at the top of the capital structure.
By industry exposure, the largest allocations were to Business Services (14.0%), Healthcare & Pharmaceuticals (11.8%), Retail (10.7%), Energy: Electricity (8.4%), and Media: Diversified & Production (6.8%).
The remaining 48.3% is spread across industries each representing less than 6.8% of the portfolio. The investment mix remains conservative, with 80.8% in senior secured first-lien debt.
On May 7th, 2026, CION Investment Corporation reported its Q1 results. Total investment income decreased 7.9% quarter over quarter to $49.5 million, driven by lower transaction fees from reduced repayment and investment activity and lower dividend income.
Net investment income fell to $0.25 per share, a 28.6% decrease from $0.35 per share in the prior quarter, reflecting lower fee and dividend income alongside higher interest expense. Net asset value decreased 4.7% quarter over quarter to $13.11 per share, down from $13.76.
Click here to download our most recent Sure Analysis report on CION (preview of page 1 of 3 shown below):
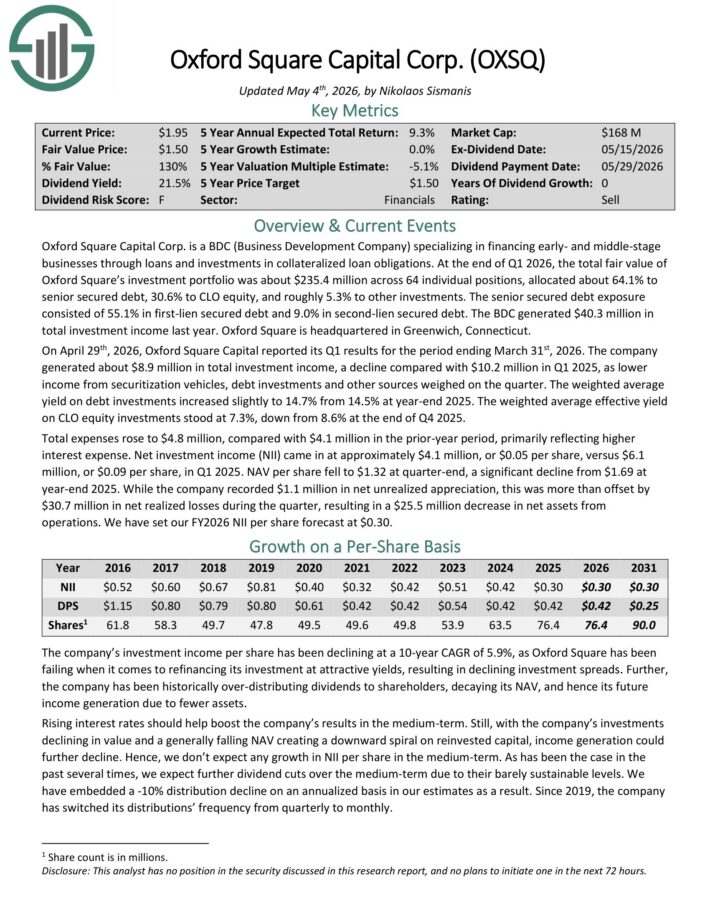
Monthly Dividend Stock #3: Oxford Square Capital (OXSQ)
5-Year Expected Total Return: 17.9%
Oxford Square Capital Corp. is a BDC (Business Development Company) specializing in financing early- and middle-stage businesses through loans and investments in collateralized loan obligations.
At the end of 2025, the total fair value of Oxford Square’s investment portfolio was about $251.7 million across its debt, CLO equity, and equity/other holdings, allocated about 58.5% to senior secured debt, 37.8% to CLO equity, and roughly 3.7% to equity or other investments.
On April 29th, 2026, Oxford Square Capital reported its Q1 results for the period ending March 31st, 2026. The company generated about $8.9 million in total investment income, a decline compared with $10.2 million in Q1 2025, as lower income from securitization vehicles, debt investments and other sources weighed on the quarter.
The weighted average yield on debt investments increased slightly to 14.7% from 14.5% at year-end 2025. The weighted average effective yield on CLO equity investments stood at 7.3%, down from 8.6% at the end of Q4 2025.
Total expenses rose to $4.8 million, compared with $4.1 million in the prior-year period, primarily reflecting higher interest expense. Net investment income (NII) came in at approximately $4.1 million, or $0.05 per share, versus $6.1 million, or $0.09 per share, in Q1 2025.
Click here to download our most recent Sure Analysis report on OXSQ (preview of page 1 of 3 shown below):
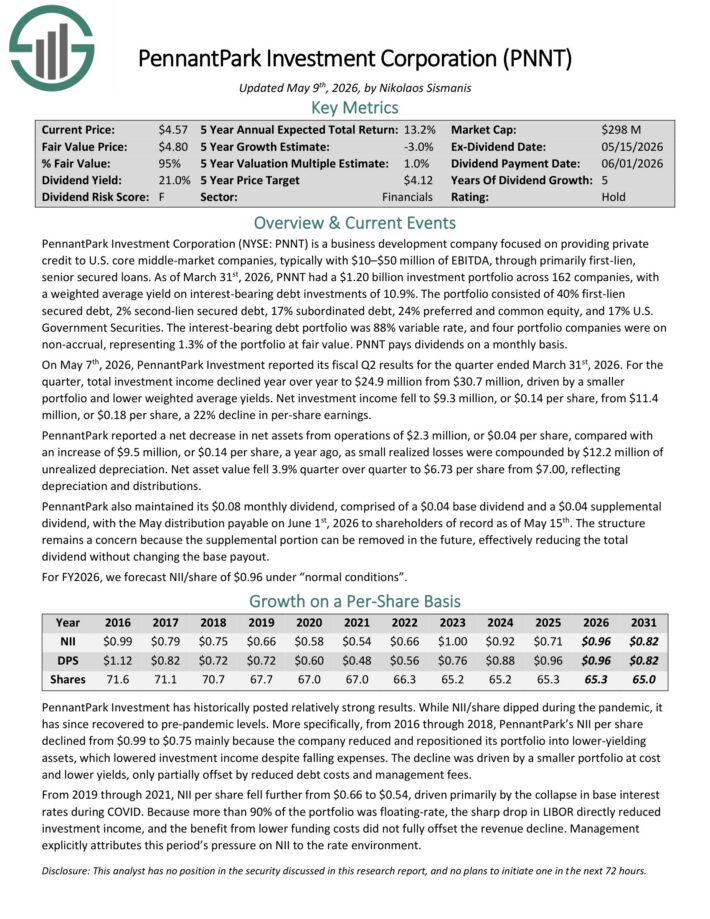
Monthly Dividend Stock #2: PennantPark Investment Corporation (PNNT)
5-Year Expected Total Return: 19.8%
PennantPark Investment Corporation is a business development company focused on providing private credit to U.S. core middle-market companies, typically with $10–$50 million of EBITDA, through primarily first-lien, senior secured loans.
As of March 31st, 2026, PNNT had a $1.20 billion investment portfolio across 162 companies, with a weighted average yield on interest-bearing debt investments of 10.9%.
The portfolio consisted of 40% first-lien secured debt, 2% second-lien secured debt, 17% subordinated debt, 24% preferred and common equity, and 17% U.S. Government Securities.
The interest-bearing debt portfolio was 88% variable rate, and four portfolio companies were on non-accrual, representing 1.3% of the portfolio at fair value.
On May 7th, 2026, PennantPark Investment reported its fiscal Q2 results. For the quarter, total investment income declined year over year to $24.9 million from $30.7 million, driven by a smaller portfolio and lower weighted average yields.
Net investment income fell to $9.3 million, or $0.14 per share, from $11.4 million, or $0.18 per share, a 22% decline in per-share earnings.
PennantPark reported a net decrease in net assets from operations of $2.3 million, or $0.04 per share, compared with an increase of $9.5 million, or $0.14 per share, a year ago.
Click here to download our most recent Sure Analysis report on PNNT (preview of page 1 of 3 shown below):
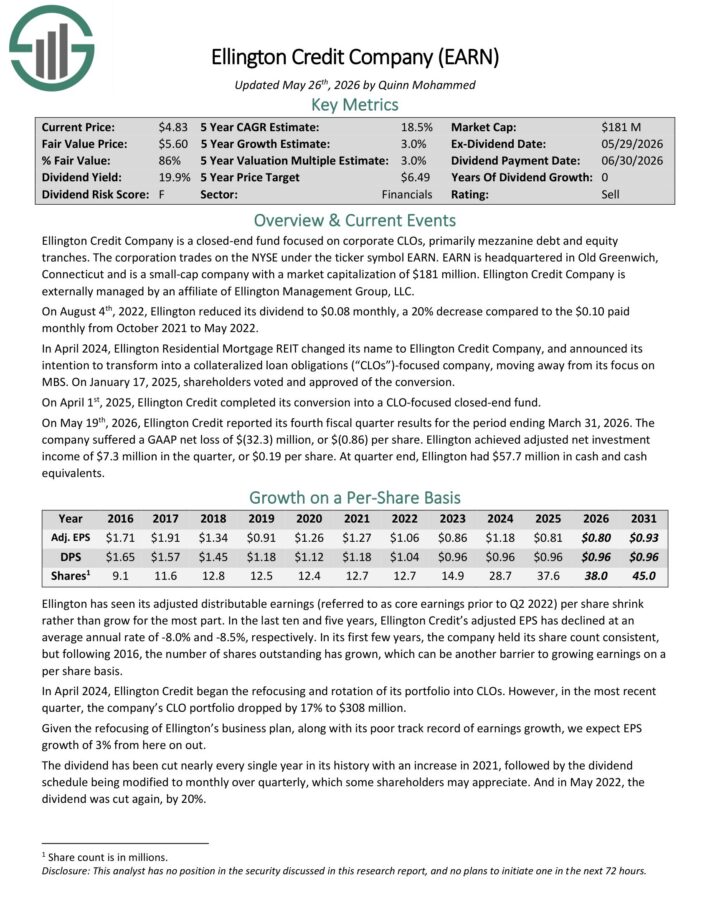
Monthly Dividend Stock #1: Ellington Credit Co. (EARN)
5-Year Expected Total Return: 20.9%
Ellington Credit Co. acquires, invests in, and manages residential mortgage and real estate related assets.
Ellington focuses primarily on residential mortgage-backed securities, specifically those backed by a U.S. Government agency or U.S. government–sponsored enterprise.
Agency MBS are created and backed by government agencies or enterprises, while non-agency MBS are not guaranteed by the government.
On May 19th, 2026, Ellington Credit reported its fourth fiscal quarter results for the period ending March 31, 2026. The company suffered a GAAP net loss of $(32.3) million, or $(0.86) per share.
Ellington achieved adjusted net investment income of $7.3 million in the quarter, or $0.19 per share. At quarter end, Ellington had $57.7 million in cash and cash equivalents.
Click here to download our most recent Sure Analysis report on EARN (preview of page 1 of 3 shown below):
Other Monthly Dividend Stock Resources
Each separate monthly dividend stock has its own unique characteristics. The resources below will give you a better understanding of monthly dividend stock investing.
The following research reports will help you generate more monthly dividend stock investment ideas.
Why Monthly Dividends MatterMonthly dividend payments are beneficial for one group of investors in particular; retirees who rely on dividend stocks for income.
With that said, monthly dividend stocks are better under all circumstances (everything else being equal), because they allow for returns to be compounded on a more frequent basis. More frequent compounding results in better total returns, particularly over long periods of time.
Consider the following performance comparison:
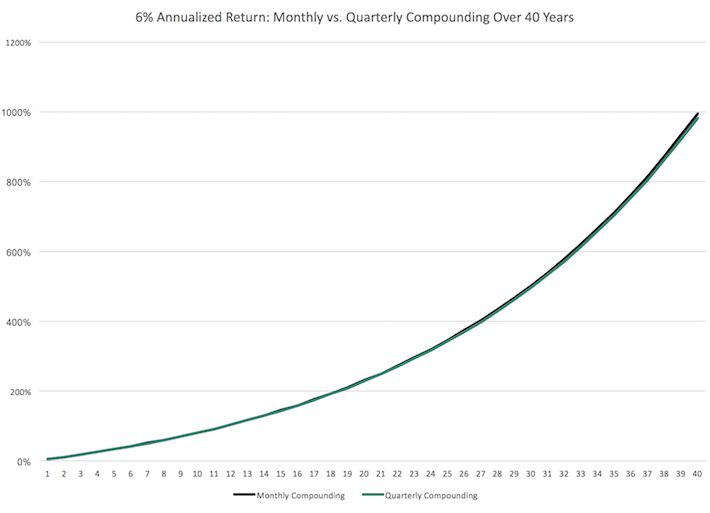
Over the long run, monthly compounding generates slightly higher returns over quarterly compounding. Every little bit helps.
With that said, it might not be practical to manually re-invest dividend payments on a monthly basis. It is more feasible to combine monthly dividend stocks with a dividend reinvestment plan to dollar cost average into your favorite dividend stocks.
The last benefit of monthly dividend stocks is that they allow investors to have – on average – more cash on hand to make opportunistic purchases. A monthly dividend payment is more likely to put cash in your account when you need it versus a quarterly dividend.
Case-in-point: Investors who bought a broad basket of stocks at the bottom of the 2008-2009 financial crisis are likely sitting on triple-digit total returns from those purchases today.
The Dangers of Investing In Monthly Dividend StocksMonthly dividend stocks have characteristics that make them appealing to do-it-yourself investors looking for a steady stream of income. Typically, these are retirees and people planning for retirement.
Investors should note many monthly dividend stocks are highly speculative. On average, monthly dividend stocks tend to have elevated payout ratios. An elevated payout ratio means there’s less margin for error to continue paying the dividend if business results suffer a temporary (or permanent) decline.
As a result, we have real concerns that many monthly dividend payers will not be able to continue paying rising dividends in the event of a recession.
Additionally, a high payout ratio means that a company is retaining little money to invest for future growth. This can lead management teams to aggressively leverage their balance sheet, fueling growth with debt. High debt and a high payout ratio is perhaps the most dangerous combination around for a potential future dividend reduction.
With that said, there are a handful of high-quality monthly dividend payers around. Chief among them is Realty Income (O). Realty Income has paid increasing dividends (on an annual basis) every year since 1994.
The Realty Income example shows that there are high-quality monthly dividend payers around, but they are the exception rather than the norm. We suggest investors do ample due diligence before buying into any monthly dividend payer.
Final Thoughts & Other Income Investing Resources
Financial freedom is achieved when your passive investment income exceeds your expenses. But the sequence and timing of your passive income investment payments can matter.
Monthly payments make matching portfolio income with expenses easier. Most personal expenses recur monthly whereas most dividend stocks pay quarterly. Investing in monthly dividend stocks matches the frequency of portfolio income payments with the normal frequency of personal expenses.
Additionally, many monthly dividend payers offer investors high yields. The combination of a monthly dividend payment and a high yield should be especially appealing to income investors.
But not all monthly dividend payers offer the safety that income investors need. A monthly dividend is better than a quarterly dividend, but not if that monthly dividend is reduced soon after you invest. The high payout ratios and shorter histories of most monthly dividend securities mean they tend to have elevated risk levels.
Because of this, we advise investors to look for high-quality monthly dividend payers with reasonable payout ratios, trading at fair or better prices.
Additionally, see the resources below for more compelling investment ideas for dividend growth stocks and/or high-yield investment securities.
Thanks for reading this article. Please send any feedback, corrections, or questions to [email protected].