

Published on May 5th, 2026 by Bob Ciura
Business Development Companies, otherwise known as BDCs, are highly popular among income investors.
That’s because BDCs widely have high dividend yields of 5% or higher.
This makes BDCs very appealing for income investors such as retirees. With this in mind, we’ve created a list of over 40 BDCs.
You can download your free copy of our BDC list, along with relevant financial metrics such as dividend yields and payout ratios, by clicking on the link below:

At the same time, monthly dividend stocks are highly appealing for income investors.
That is because these particular stocks pay dividends every month, instead of once per quarter or semi-annually like most dividend-paying stocks.
In this analysis, we have combined these qualities to list 10 high-yield BDCs with monthly dividends.
Table Of Contents
The 10 BDCs below are listed by current dividend yield, from lowest to highest:
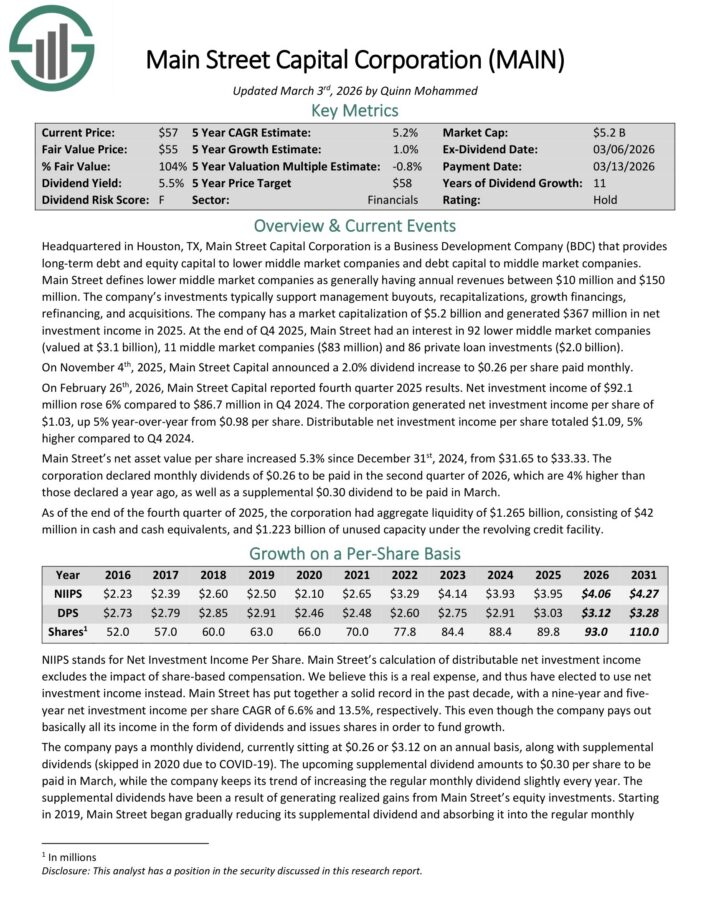
High Dividend Monthly Paying BDC #10: Main Street Capital (MAIN)
Main Street Capital Corporation is a Business Development Company (BDC) that provides long-term debt and equity capital to lower middle market companies and debt capital to middle market companies.
Main Street defines lower middle market companies as generally having annual revenues between $10 million and $150 million.
The company’s investments typically support management buyouts, recapitalizations, growth financings, refinancing, and acquisitions.
On February 26th, 2026, Main Street Capital reported fourth quarter 2025 results. Net investment income of $92.1 million rose 6% compared to $86.7 million in Q4 2024.
The corporation generated net investment income per share of $1.03, up 5% year-over-year from $0.98 per share. Distributable net investment income per share totaled $1.09, 5% higher compared to Q4 2024.
Main Street’s net asset value per share increased 5.3% since December 31st, 2024, from $31.65 to $33.33.
The corporation declared monthly dividends of $0.26 to be paid in the second quarter of 2026, which are 4% higher than those declared a year ago, as well as a supplemental $0.30 dividend to be paid in March.
Click here to download our most recent Sure Analysis report on MAIN (preview of page 1 of 3 shown below):
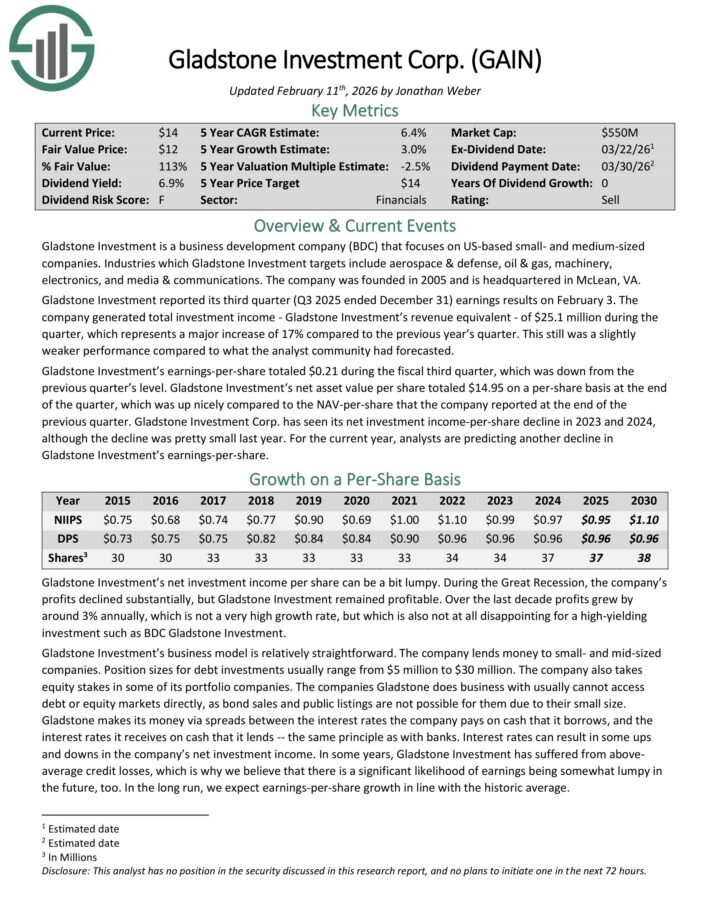
High Dividend Monthly Paying BDC #9: Gladstone Investment Corp. (GAIN)
Gladstone Investment is a business development company (BDC) that focuses on US-based small- and medium-sized companies.
Industries which Gladstone Investment targets include aerospace & defense, oil & gas, machinery, electronics, and media & communications. The company was founded in 2005 and is headquartered in McLean, VA.
Gladstone Investment reported its third quarter (Q3 2025 ended December 31) earnings results on February 3. The company generated total investment income of $25.1 million during the quarter, an increase of 17% compared to the previous year’s quarter.
This still was a slightly weaker performance compared to what the analyst community had forecast. Gladstone Investment’s earnings-per-share totaled $0.21 during the fiscal third quarter, which was down from the previous quarter.
Gladstone Investment‘s net asset value per share totaled $14.95 on a per-share basis at the end of the quarter, which was up nicely compared to the NAV-per-share that the company reported at the end of the previous quarter.
Click here to download our most recent Sure Analysis report on GAIN (preview of page 1 of 3 shown below):
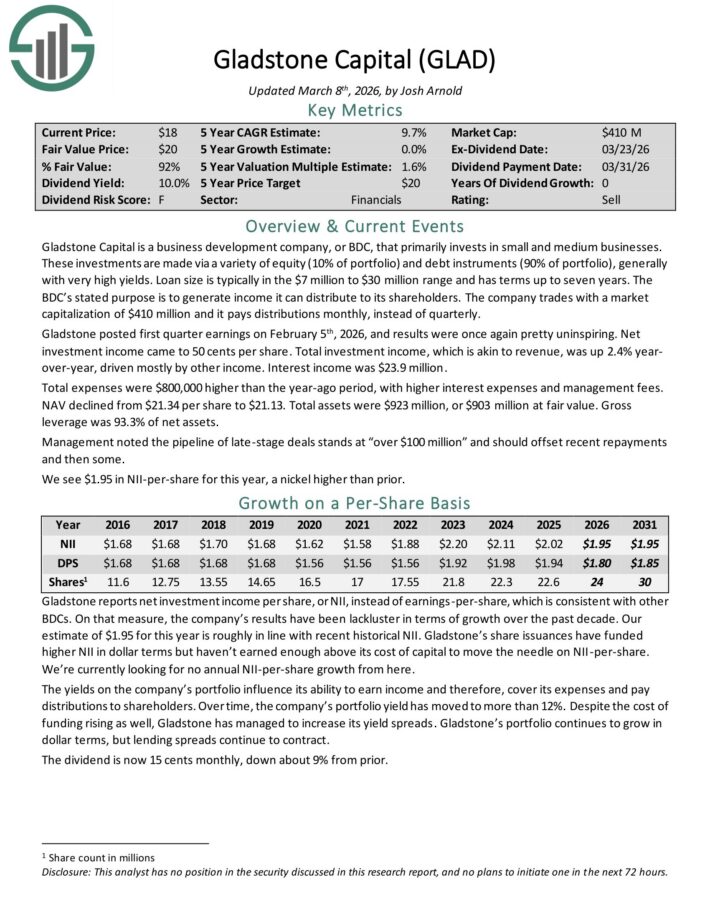
High Dividend Monthly Paying BDC #8: Gladstone Capital (GLAD)
Gladstone Capital is a business development company, or BDC, that primarily invests in small and medium businesses.
These investments are made via a variety of equity (10% of portfolio) and debt instruments (90% of portfolio), generally with very high yields.
Loan size is typically in the $7 million to $30 million range and has terms up to seven years.
Gladstone posted first quarter earnings on February 5th, 2026. Net investment income came to 50 cents per share. Total investment income, which is akin to revenue, was up 2.4% year-over-year, driven mostly by other income.
Interest income was $23.9 million. Total expenses were $800,000 higher than the year-ago period, with higher interest expenses and management fees.
NAV declined from $21.34 per share to $21.13. Total assets were $923 million, or $903 million at fair value. Gross leverage was 93.3% of net assets.
For 2026, we expect $1.95 in NII-per-share for GLAD.
Click here to download our most recent Sure Analysis report on GLAD (preview of page 1 of 3 shown below):
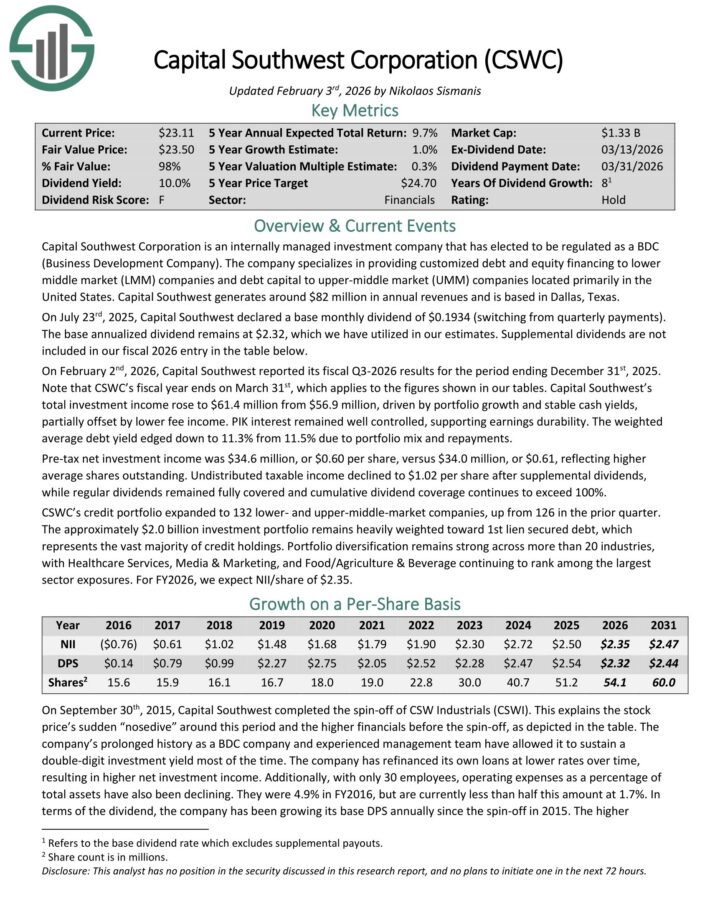
High Dividend Monthly Paying BDC #7: Capital Southwest Corp. (CSWC)
Capital Southwest Corporation is an internally managed investment company that has elected to be regulated as a BDC.
The company specializes in providing customized debt and equity financing to lower middle market (LMM) companies and debt capital to upper-middle market (UMM) companies located primarily in the United States.
Capital Southwest generates around $82 million in annual revenue.
On February 2nd, 2026, Capital Southwest reported its fiscal Q3-2026 results. Total investment income rose to $61.4 million from $56.9 million, driven by portfolio growth and stable cash yields, partially offset by lower fee income.
PIK interest remained well controlled, supporting earnings durability. The weighted average debt yield edged down to 11.3% from 11.5% due to portfolio mix and repayments.
Pre-tax net investment income was $34.6 million, or $0.60 per share, versus $34.0 million, or $0.61, reflecting higher average shares outstanding.
Undistributed taxable income declined to $1.02 per share after supplemental dividends, while regular dividends remained fully covered and cumulative dividend coverage continues to exceed 100%.
Click here to download our most recent Sure Analysis report on CSWC (preview of page 1 of 3 shown below):
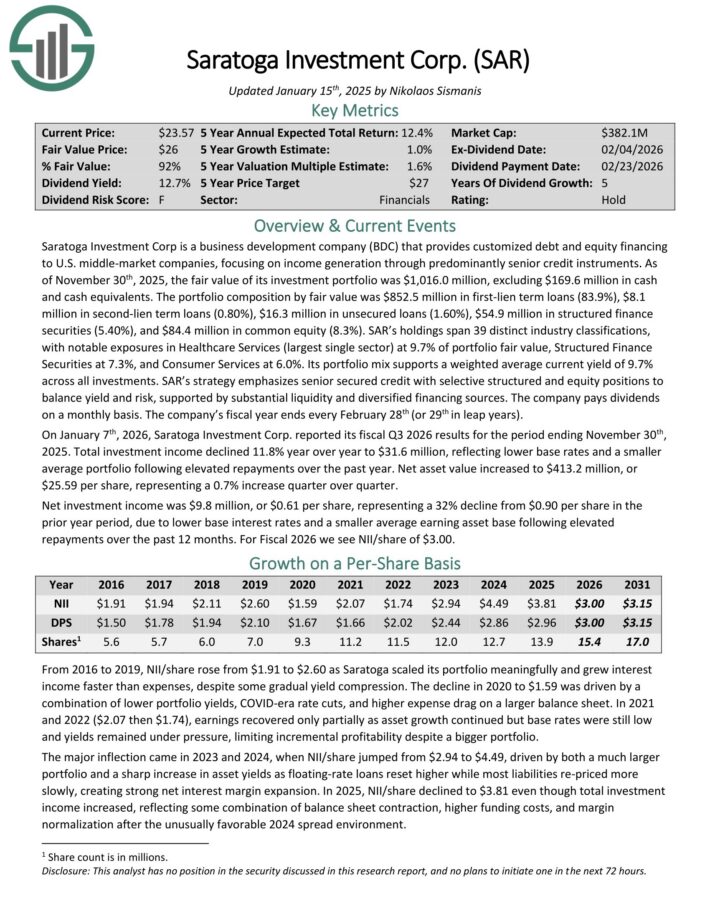
High Dividend Monthly Paying BDC #6: Saratoga Investment Corp. (SAR)
Saratoga Investment Corp is a business development company (BDC) that provides customized debt and equity financing to U.S. middle-market companies, focusing on income generation through predominantly senior credit instruments.
As of November 30th, 2025, the fair value of its investment portfolio was $1,016.0 million, excluding $169.6 million in cash and cash equivalents.
The portfolio composition by fair value was $852.5 million in first-lien term loans (83.9%), $8.1 million in second-lien term loans (0.80%), $16.3 million in unsecured loans (1.60%), $54.9 million in structured finance securities (5.40%), and $84.4 million in common equity (8.3%).
SAR’s holdings span 39 distinct industry classifications, with notable exposures in Healthcare Services (largest single sector) at 9.7% of portfolio fair value, Structured Finance Securities at 7.3%, and Consumer Services at 6.0%.
On January 7th, 2026, Saratoga Investment Corp. reported its fiscal Q3 2026 results for the period ending November 30th, 2025. Total investment income declined 11.8% year over year to $31.6 million, reflecting lower base rates and a smaller average portfolio following elevated repayments over the past year.
Net asset value increased to $413.2 million, or $25.59 per share, representing a 0.7% increase quarter over quarter. Net investment income was $9.8 million, or $0.61 per share, representing a 32% decline from $0.90 per share in the prior year period.
The decline was due to lower base interest rates and a smaller average earning asset base following elevated repayments over the past 12 months.
Click here to download our most recent Sure Analysis report on SAR (preview of page 1 of 3 shown below):
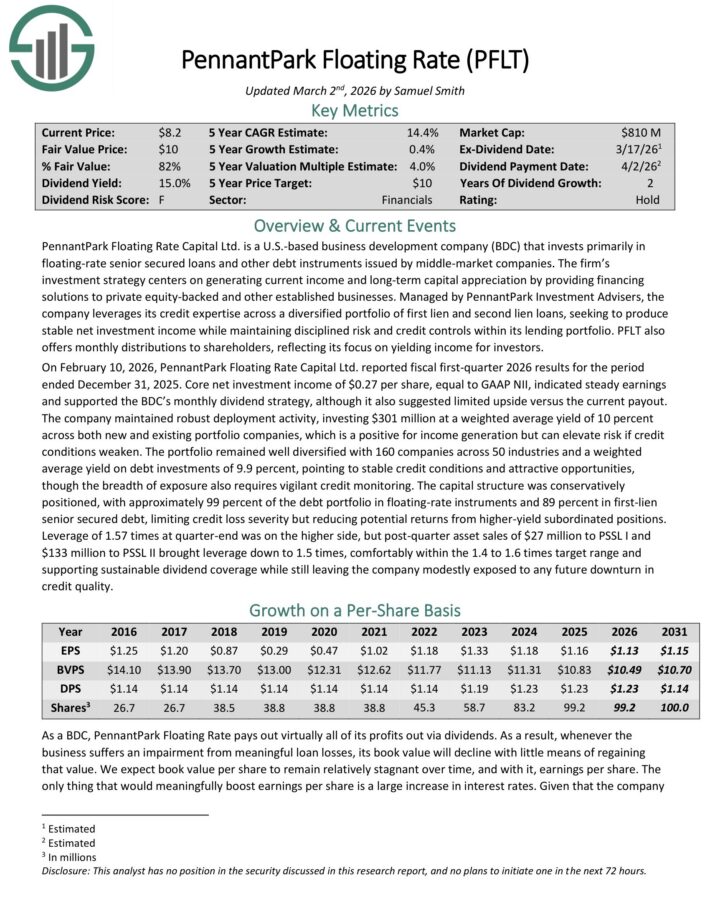
High Dividend Monthly Paying BDC #5: PennantPark Floating Rate Capital (PFLT)
PennantPark Floating Rate Capital Ltd. is a business development company that seeks to make secondary direct, debt, equity, and loan investments.
The fund also aims to invest through floating rate loans in private or thinly traded or small market-cap, public middle market companies, equity securities, preferred stock, common stock, warrants or options received in connection with debt investments or through direct investments.
On February 10, 2026, PennantPark Floating Rate Capital Ltd. reported fiscal first-quarter 2026 results for the period ended December 31, 2025.
Core net investment income of $0.27 per share, equal to GAAP NII, indicated steady earnings and supported the BDC’s monthly dividend strategy, although it also suggested limited upside versus the current payout.
The company maintained robust deployment activity, investing $301 million at a weighted average yield of 10% across both new and existing portfolio companies, which is a positive for income generation but can elevate risk if credit conditions weaken.
The portfolio remained well diversified with 160 companies across 50 industries and a weighted average yield on debt investments of 9.9%, pointing to stable credit conditions and attractive opportunities, though the breadth of exposure also requires vigilant credit monitoring.
Leverage of 1.57 times at quarter-end was on the higher side, but post-quarter asset sales of $27 million to PSSL I and $133 million to PSSL II brought leverage down to 1.5 times, comfortably within the 1.4 to 1.6 times target range andsupporting sustainable dividend coverage.
Click here to download our most recent Sure Analysis report on PFLT (preview of page 1 of 3 shown below):
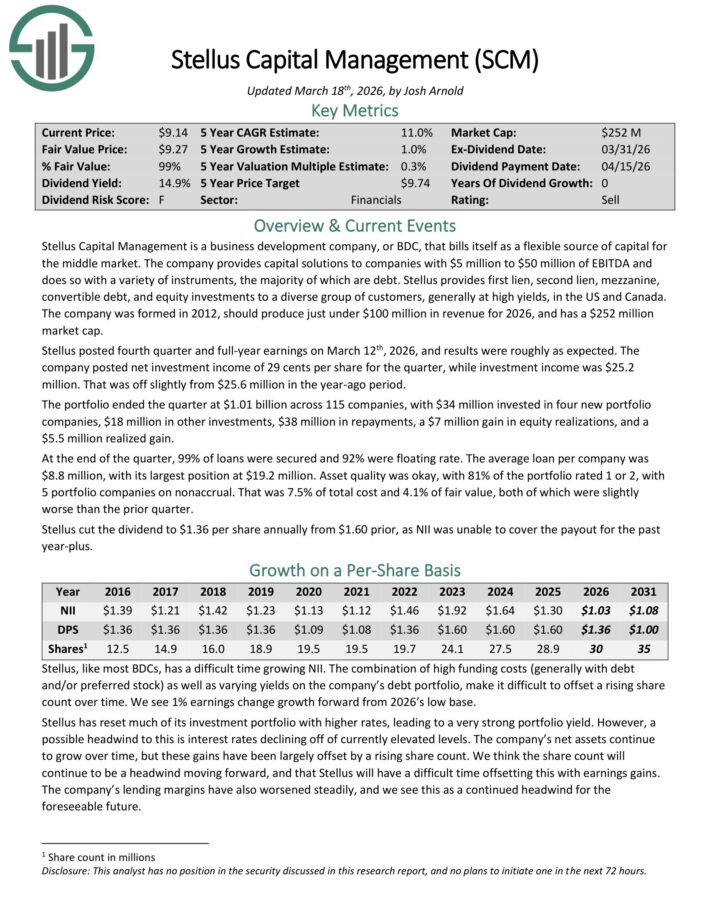
High Dividend Monthly Paying BDC #4: Stellus Capital (SCM)
Stellus Capital Management provides capital solutions to companies with $5 million to $50 million of EBITDA and does so with a variety of instruments, the majority of which are debt.
Stellus provides first lien, second lien, mezzanine, convertible debt, and equity investments to a diverse group of customers, generally at high yields, in the US and Canada.
Stellus posted fourth quarter and full-year earnings on March 12th, 2026. The company posted net investment income of 29 cents per share for the quarter, while investment income was $25.2 million. That was off slightly from $25.6 million in the year-ago period.
The portfolio ended the quarter at $1.01 billion across 115 companies, with $34 million invested in four new portfolio companies, $18 million in other investments, $38 million in repayments, a $7 million gain in equity realizations, and a $5.5 million realized gain.
At the end of the quarter, 99% of loans were secured and 92% were floating rate. The average loan per company was $8.8 million, with its largest position at $19.2 million.
Asset quality was okay, with 81% of the portfolio rated 1 or 2, with 5 portfolio companies on nonaccrual. That was 7.5% of total cost and 4.1% of fair value, both of which were slightly worse than the prior quarter.
Stellus cut the dividend to $1.36 per share annually from $1.60.
Click here to download our most recent Sure Analysis report on SCM (preview of page 1 of 3 shown below):
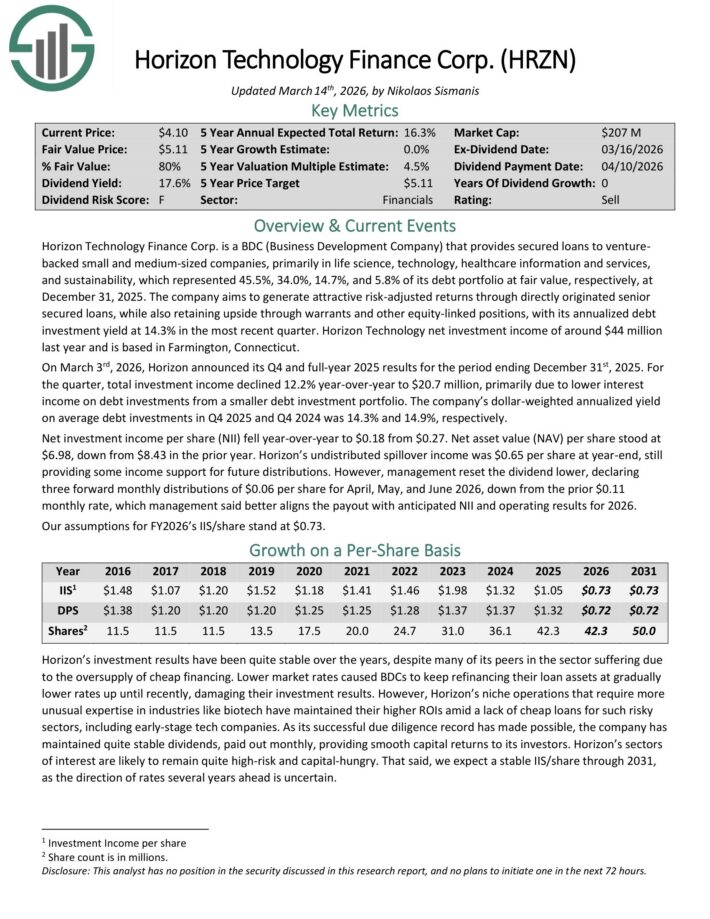
High Dividend Monthly Paying BDC #3: Horizon Technology Finance (HRZN)
Horizon Technology Finance Corp. is a BDC that provides venture capital to small and medium–sized companies in the technology, life sciences, and healthcare–IT sectors.
The company has generated attractive risk–adjusted returns through directly originated senior secured loans and additional capital appreciation through warrants.
Horizon Technology Finance Corp. is a BDC that provides venture capital to small and medium–sized companies in the technology, life sciences, and healthcare–IT sectors.
On March 3rd, 2026, Horizon announced its Q4 and full-year 2025 results. For the quarter, total investment income declined 12.2% year-over-year to $20.7 million, primarily due to lower interest income on debt investments from a smaller debt investment portfolio.
The company’s dollar-weighted annualized yield on average debt investments in Q4 2025 and Q4 2024 was 14.3% and 14.9%, respectively.
Net investment income per share (NII) fell year-over-year to $0.18 from $0.27. Net asset value (NAV) per share stood at $6.98, down from $8.43 in the prior year.
Horizon’s undistributed spillover income was $0.65 per share at year-end, still providing some income support for future distributions.
Click here to download our most recent Sure Analysis report on HRZN (preview of page 1 of 3 shown below):
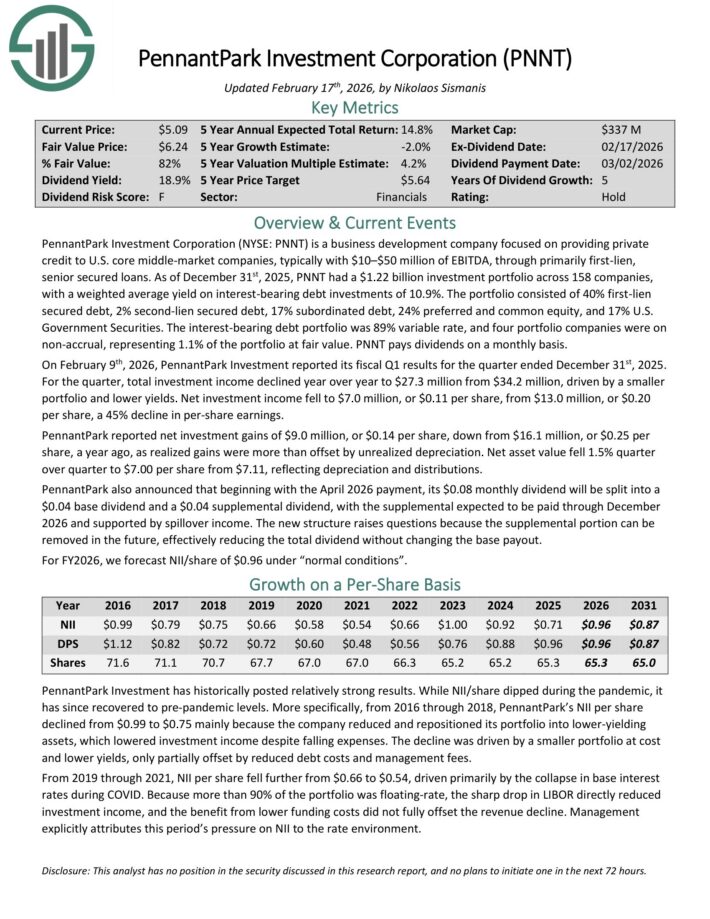
High Dividend Monthly Paying BDC #2: PennantPark Investment Corp. (PNNT)
PennantPark Investment Corporation is focused on providing private credit to U.S. core middle-market companies, typically with $10–$50 million of EBITDA, through primarily first-lien, senior secured loans.
As of December 31st, 2025, PNNT had a $1.22 billion investment portfolio across 158 companies, with a weighted average yield on interest-bearing debt investments of 10.9%.
The portfolio consisted of 40% first-lien secured debt, 2% second-lien secured debt, 17% subordinated debt, 24% preferred and common equity, and 17% U.S. Government Securities.
The interest-bearing debt portfolio was 89% variable rate, and four portfolio companies were on non-accrual, representing 1.1% of the portfolio at fair value.
On February 9th, 2026, PennantPark Investment reported its fiscal Q1 results for the quarter ended December 31st, 2025. For the quarter, total investment income declined year over year to $27.3 million from $34.2 million, driven by a smaller portfolio and lower yields.
Net investment income fell to $7.0 million, or $0.11 per share, from $13.0 million, or $0.20 per share, a 45% decline in per-share earnings.
PennantPark reported net investment gains of $9.0 million, or $0.14 per share, down from $16.1 million, or $0.25 per share, a year ago, as realized gains were more than offset by unrealized depreciation.
Net asset value fell 1.5% quarter over quarter to $7.00 per share from $7.11, reflecting depreciation and distributions.
Click here to download our most recent Sure Analysis report on PNNT (preview of page 1 of 3 shown below):
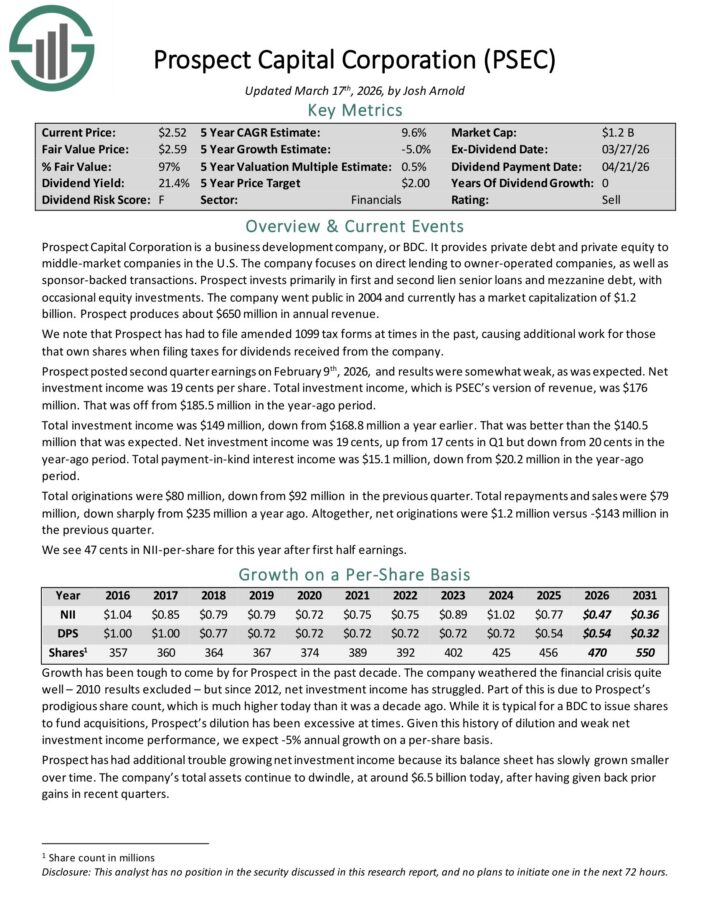
High Dividend Monthly Paying BDC #1: Prospect Capital (PSEC)
Prospect Capital Corporation is a Business Development Company, or BDC, that provides private debt and private equity to middle–market companies in the U.S.
The company focuses on direct lending to owner–operated companies, as well as sponsor–backed transactions. Prospect invests primarily in first and second lien senior loans and mezzanine debt, with occasional equity investments.
Prospect posted second quarter earnings on February 9th, 2026, and results were somewhat weak. Net investment income was 19 cents per share.
Total investment income, which is PSEC’s version of revenue, was $176 million. That was off from $185.5 million in the year-ago period.
Total investment income was $149 million, down from $168.8 million a year earlier. That was better than the $140.5 million that was expected.
Net investment income was 19 cents, up from 17 cents in Q1 but down from 20 cents in the year-ago period. Total payment-in-kind interest income was $15.1 million, down from $20.2 million in the year-ago period.
Total originations were $80 million, down from $92 million in the previous quarter. Total repayments and sales were $79 million, down sharply from $235 million a year ago.
Altogether, net originations were $1.2 million versus -$143 million in the previous quarter.
For 2026, we see 47 cents in NII-per-share for this year after first half earnings.
Click here to download our most recent Sure Analysis report on PSEC (preview of page 1 of 3 shown below):
Additional Resources
At Sure Dividend, we often advocate for investing in companies with a high probability of increasing their dividends each and every year.
If that strategy appeals to you, it may be useful to browse through the following databases of dividend growth stocks:
Thanks for reading this article. Please send any feedback, corrections, or questions to [email protected].


")

-1024x683.jpg "Strait Outta Hormuz: Getting the Iran Oil Story Straight")


