


Michael Saylor dropped another hint at buying more Bitcoin (BTC) this week. Ahead of Monday, the day Strategy mostly announces BTC buying, Saylor’s famous “Orange Dots” post made it to X.
Michael Saylor Teases More BTC Buy
Strategy’s Michael Saylor’s wrote on X, “Think even Bigger.” He attached the “Orange Dots” chart to hint at a potential BTC acquisition this week, which could possibly be “bigger” than the last Monday. For context, the chart depicts all the purchases by Strategy to date. Whenever Saylor posts this chart, the company mostly follows with a notable Bitcoin buying initiative.
Earlier, last week, Strategy bought another $1 billion worth of Bitcoin on Monday, April 13. Prior to this buying as well, Michael Saylor had posted the ‘Orange Dots’ illustration. Moreover, even the week before that a similar trend ensued with a $330 million BTC purchase.
Hence, Bitcoin maximalists are hopeful on another buying on Monday, April 20. As of writing, the company holds 780,897 BTC in its Bitcoin treasury with an average price at $75,577. Moreover, the stash is currently worth $58.09 billion at the prevailing BTC price, per on-chain tracking crypto tools.
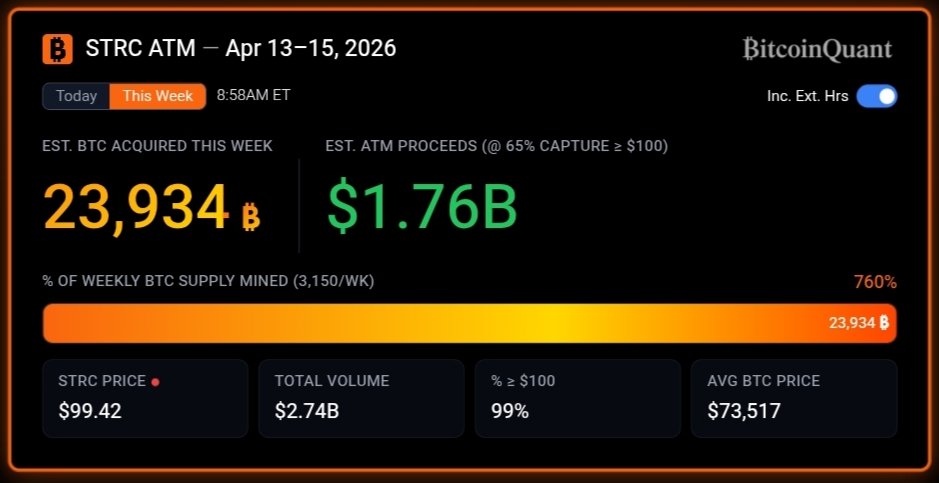
In addition, it’s worth noting that Michael Saylor-backed STRC has snapped up enough capital to buy $1.76 billion BTC this week. These proceeds could be used in upcoming Bitcoin acquisitions as the company generally fuels its BTC buying with STRC proceeds.
Also Read: Strategy Reveals New STRC Dividend Proposal as Peter Schiff Calls Saylor ‘Fraud’
What’s Happening With BTC Price?
Amid Michael Saylor’s latest comment, Bitcoin continues to struggle. At press time, the BTC price was consolidating at $75,838.82, down 0.48% in the last 24 hours. The price action comes as geopolitical tensions are rising as U.S. President Donald Trump accused Iran of violating the ceasefire agreements.
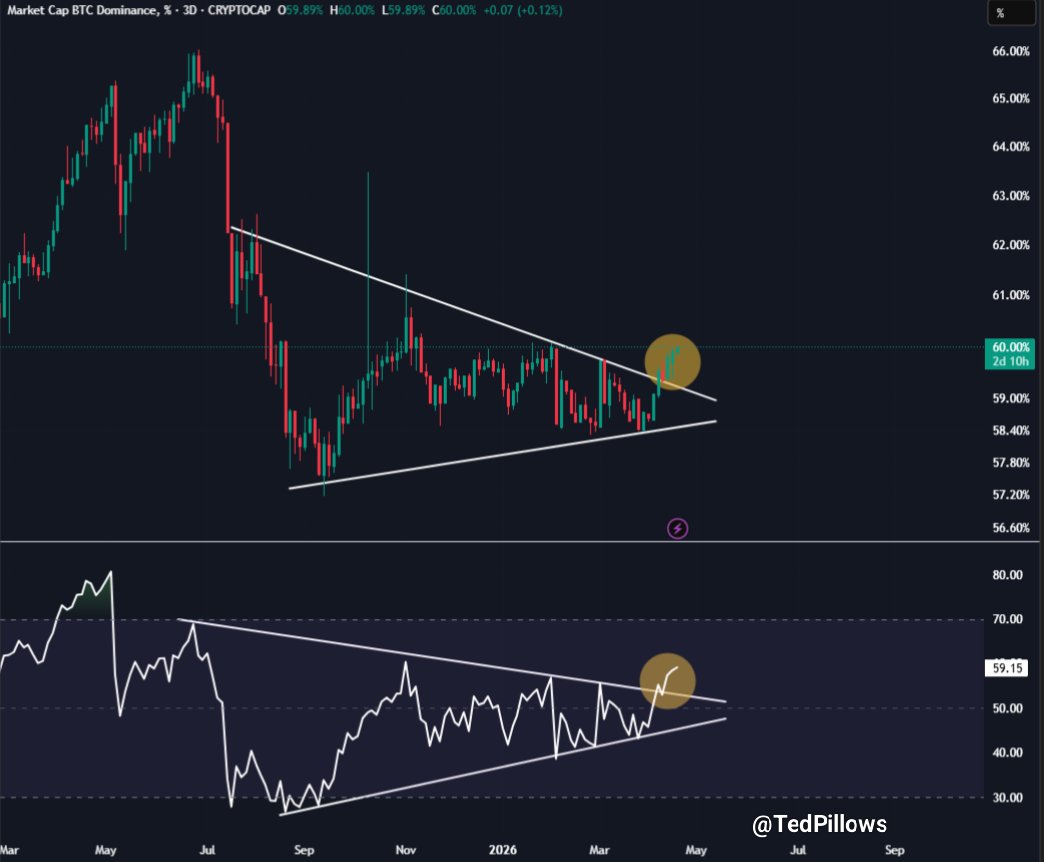
However, Bitcoin Dominance (BTC.D) just marked a major breakout. Crypto analyst Ted Pillows said that this is “not a good sign” for altcoins as BTC could gain further momentum. Previously, the Bitcoin dominance was stuck in a symmetrical triangle, according to the 3-day timeframe chart by Pillows.
The triangle shows a series of lower highs and higher lows. Now that Bitcoin Dominance has broken above the descending resistance line, it’s close to the 60% level. If the breakout sustains, it could lead to further influx of capital into BTC with Michael Saylor potentially leading the charge. It could push the BTC price up as witnessed in historical trends as investors’ risk appetite generally reduces in such scenarios.


")

")


