Updated on July 22nd, 2026 by Nick SismanisWith contributions from Ben Reynolds
Stocks with low P/E ratios can offer attractive returns if their valuation multiples expand.
And when a low P/E stock also has a high dividend yield, investors get “paid to wait” for the valuation multiple to increase.
Bonus: Don’t miss our free high dividend stocks list spreadsheet. it has metrics that matter on every 4.0%+ dividend yield security we cover in the Sure Analysis Research Database.
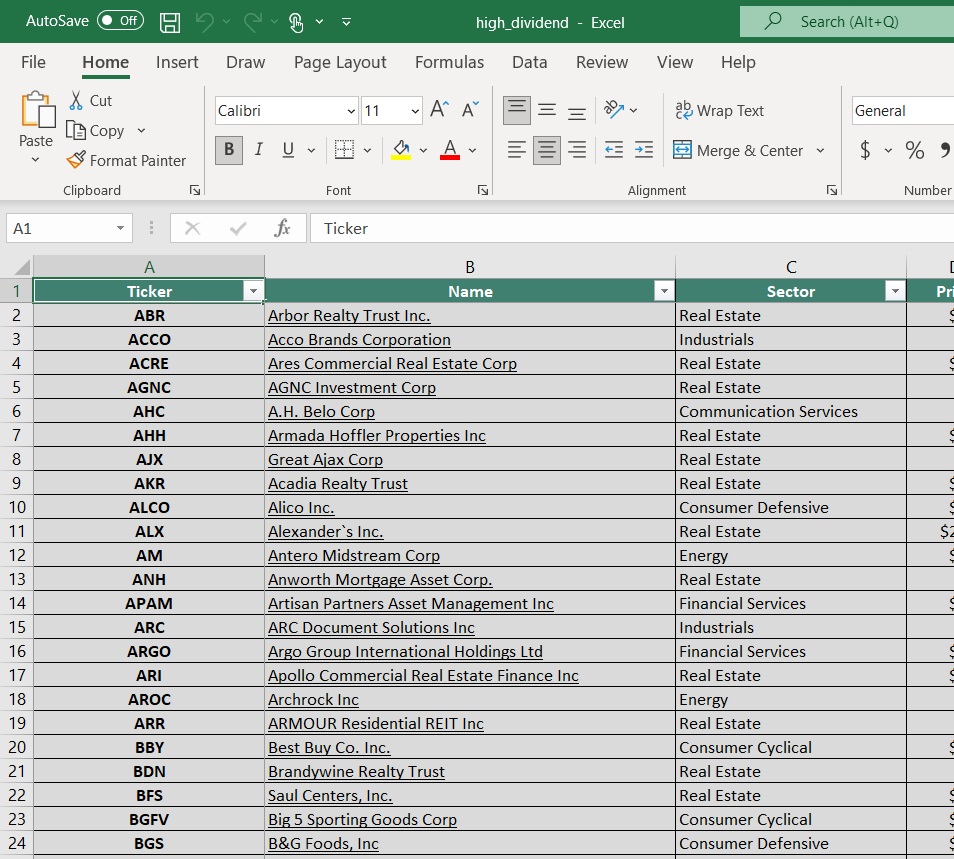
This research report analyzes the 20 highest yielding securities in the 900+ income security Sure Analysis Research Database that match the following criteria:
P/E ratio less than 10.0
No international securities
Sort by dividend yield (highest to lowest)
In this research report, we have organized securities by P/E ratio, from highest to lowest (deepest value).
Note: For REITs we use P/FFO (funds from operations) instead of P/E. For MLPs we use P/DCF (distributable cash flows). For BDCs we use P/NII (net investment income). These are comparable metrics similar to earnings for common stocks.
These 20 dividend stocks have not been screened for dividend safety. This means they are only a starting point for ideas, and aren’t necessarily solid long-term investment opportunities.
Table of Contents
Keep reading to see analysis on these 20 undervalued high dividend stocks.
Undervalued High Dividend Stock #20: Dynex Capital, Inc. (DX)
P/E Ratio: 9.7
Dividend Yield: 15.6%
Dynex Capital is an internally managed mortgage REIT that invests mainly in Agency residential and commercial mortgage-backed securities. Its returns come from the spread between the income earned on these securities and its financing costs, together with changes in portfolio values.
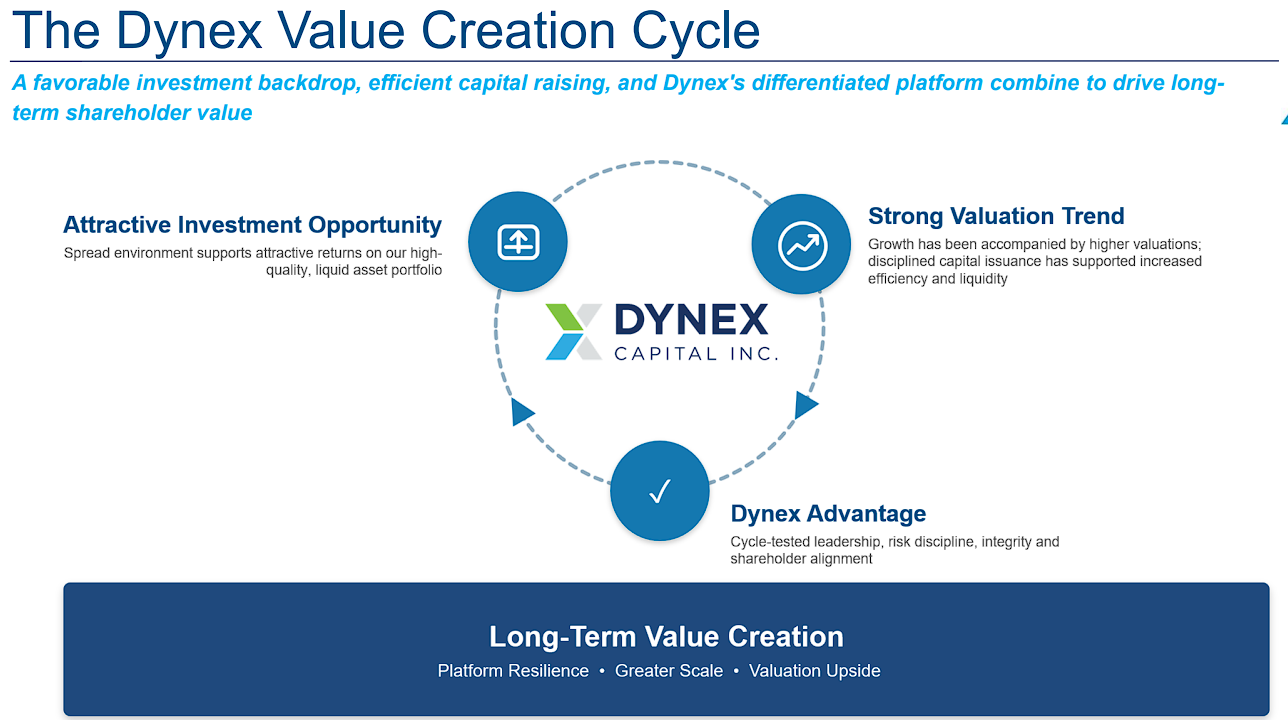
This structure can produce substantial income, but book value remains sensitive to interest rates, mortgage spreads, prepayments, and leverage.
On July 20th, 2026, Dynex reported second-quarter results. The company generated a total economic return of $0.81 per share, equal to 6.4% of beginning book value. This consisted of a $0.30 increase in book value and $0.51 of dividends.
Book value ended the quarter at $12.90 per share, while net and comprehensive income were both $0.80 per share.
Dynex also raised $391 million through its at-the-market program and deployed the proceeds into $2.8 billion of additional Agency mortgage-backed securities.
Its total portfolio increased 11% to $27.6 billion, with 99.99% invested in liquid Agency securities. Liquidity stood at $1.6 billion, while leverage, including TBA securities, declined to 8.1 times equity.
The quarter was strong, although the enlarged capital base and continued share issuance make per-share performance the key metric to monitor.
Deep Dive: Click here to download our most recent Sure Analysis report on DX.
Undervalued High Dividend Stock #19: Innovative Industrial Properties, Inc. (IIPR)
P/FFO Ratio: 9.2
Dividend Yield: 11.9%
Innovative Industrial Properties is an internally managed REIT that owns specialized industrial properties leased to state-licensed cannabis operators.
The company generally acquires cultivation and processing facilities through sale-leaseback transactions and signs long-term, triple-net leases.
This model historically generated strong margins and dividend growth, though tenant defaults and the limited financing options available to cannabis operators have recently increased risk.
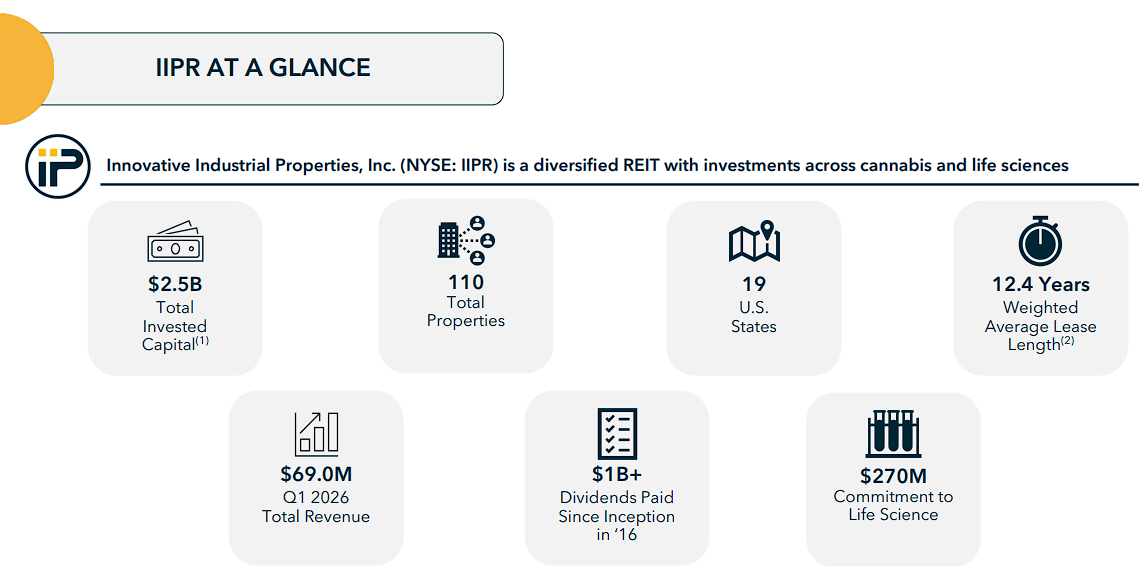
On May 4th, 2026, Innovative Industrial reported first-quarter revenue of $69.0 million, down 3.8% from the prior year. The decline primarily reflected a $6.9 million reduction tied to tenant defaults, partly offset by contractual rent increases, a property acquired in 2025, and new leases.
Adjusted funds from operations were $53.4 million, or $1.88 per share, compared with $1.94 per share a year earlier. The company declared $1.90 per share of common dividends during the quarter.
Leasing activity has nevertheless improved, with nearly 400,000 square feet of leases executed year-to-date. Innovative Industrial also raised preferred and common equity, repurchased discounted notes, and arranged additional secured financing to address an upcoming bond maturity.
Debt remained modest at 13% of gross assets, with $176.6 million of liquidity. The balance sheet remains a major strength, but tenant credit and property re-leasing remain central to the outlook.
Deep Dive: Click here to download our most recent Sure Analysis report on IIPR.
Undervalued High Dividend Stock #18: Trinity Capital Inc. (TRIN)
P/NII Ratio: 8.6
Dividend Yield: 11.4%
Trinity Capital is an internally managed business development company and alternative asset manager that provides growth capital to venture-backed and growth-stage businesses.
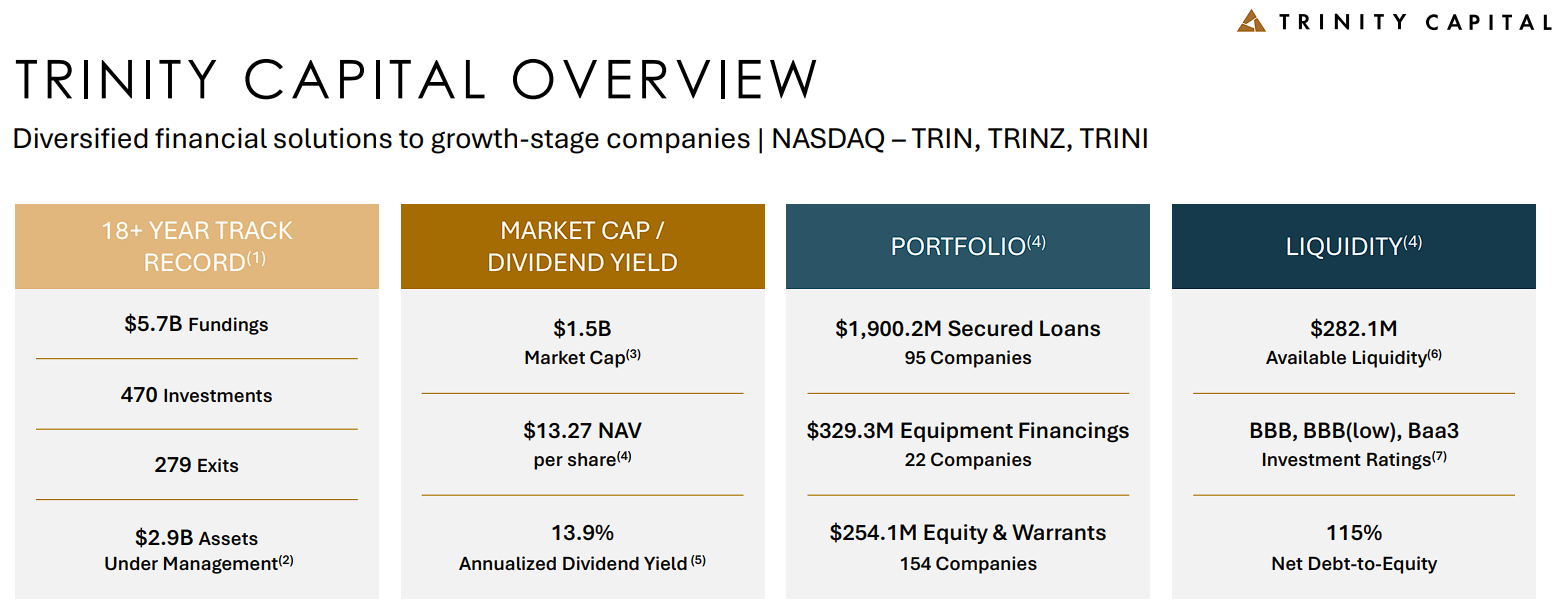
Its portfolio includes secured loans, equipment financings, and equity or warrant positions, giving the company both recurring interest income and potential capital appreciation.
These borrowers can grow quickly, but they also tend to carry greater credit and valuation risk than mature middle-market companies.
On May 6th, 2026, Trinity reported record first-quarter net investment income of $44.5 million, or $0.53 per share, up 37.4% from the prior year. Total investment income rose 37.8% to $90.1 million, while the effective yield on average debt investments increased to 15.8%.
Net asset value reached $1.2 billion, or $13.27 per share, compared with $13.42 at the end of 2025. The investment portfolio totaled about $2.5 billion across 180 companies. Approximately $1.9 billion was invested in secured loans, with another $329 million in equipment financings.
Trinity funded $306 million during the quarter and received $238 million from exits and repayments. It paid monthly distributions of $0.17 for April, May, and June.
Earnings currently cover the regular payout, though realized losses, portfolio marks, and continued equity issuance deserve close attention.
Deep Dive: Click here to download our most recent Sure Analysis report on TRIN.
Undervalued High Dividend Stock #17: MSC Income Fund, Inc. (MSIF)
P/E Ratio: 8.5
Dividend Yield: 11.7%
MSC Income Fund is an externally managed business development company advised by an affiliate of Main Street Capital. It primarily provides debt capital to private U.S. companies, including first-lien loans, and also holds selected equity investments.
The fund benefits from Main Street’s underwriting platform and deal flow, while its portfolio is intended to generate current income with some potential for capital gains.
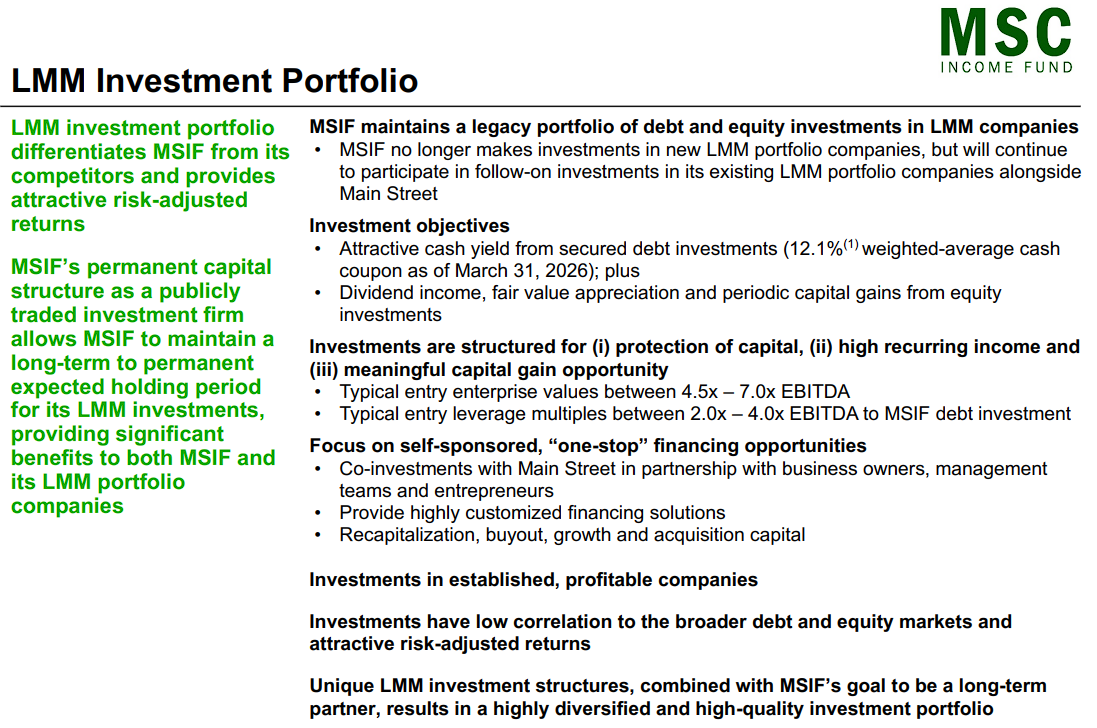
On May 7th, 2026, MSC Income reported first-quarter total investment income of $34.1 million. Net investment income was $16.2 million, or $0.35 per share, while adjusted net investment income was $15.6 million, or $0.34 per share. Net asset value ended the quarter at $15.87 per share.
The fund also repurchased $16.0 million of common stock below net asset value, adding approximately $0.08 per share to NAV. A noteworthy development was the decision to move from quarterly to monthly regular dividends beginning in July 2026.
MSC declared monthly payments of $0.11 per share for July, August, and September, plus a $0.03 supplemental dividend payable in September.
The regular third-quarter payout totals $0.33 per share, slightly below first-quarter adjusted NII.
The buybacks and monthly schedule are shareholder-friendly, but investors should still watch credit marks and whether recurring earnings fully cover both regular and supplemental distributions.
Deep Dive: Click here to download our most recent Sure Analysis report on MSIF.
Undervalued High Dividend Stock #16: Ellington Financial Inc. (EFC)
P/E Ratio: 8.5
Dividend Yield: 11.5%
Ellington Financial is a diversified mortgage and consumer-credit investment company structured as a REIT. Its portfolio includes residential and commercial mortgage loans, non-Agency and Agency mortgage-backed securities, consumer loans, and other credit assets.
It also owns Longbridge Financial, a reverse-mortgage origination and servicing platform, which adds fee income and securitization earnings alongside the investment portfolio.
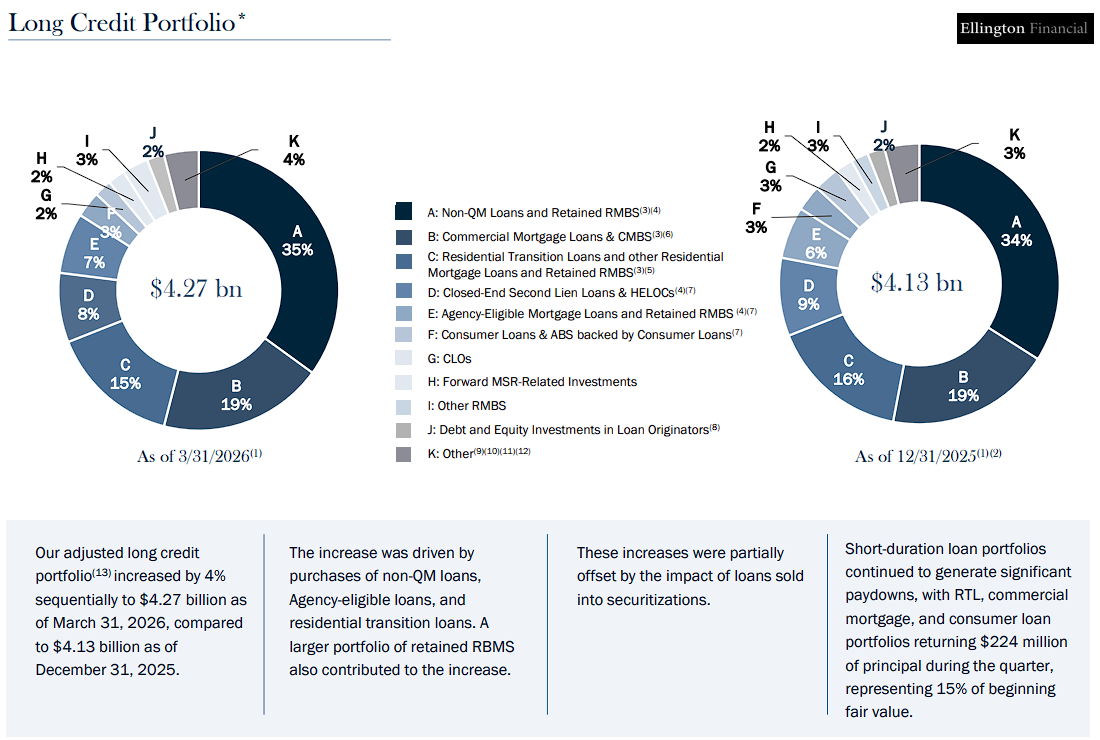
On May 5th, 2026, Ellington reported first-quarter net income attributable to common shareholders of $95.5 million, or $0.78 per share. Adjusted distributable earnings were $66.5 million, or $0.55 per share, comfortably above the $0.39 of dividends declared for the quarter.
Book value increased to $13.56 per share despite the dividend. Longbridge was a major contributor, producing $0.47 per share of net income and $0.21 of adjusted distributable earnings.
The broader investment portfolio also performed well, led by the credit strategy. Ellington ended the quarter with $1.92 billion of unencumbered assets and a recourse debt-to-equity ratio of 1.9 times.
Total leverage was much higher at 9.0 times when securitization-related non-recourse debt was included.
Diversification and dividend coverage were favorable, but the company remains exposed to credit performance, mortgage-market liquidity, and the valuation of leveraged assets.
Deep Dive: Click here to download our most recent Sure Analysis report on EFC.
Undervalued High Dividend Stock #15: Stellus Capital Investment Corporation (SCM)
P/NII Ratio: 7.1
Dividend Yield: 18.6%
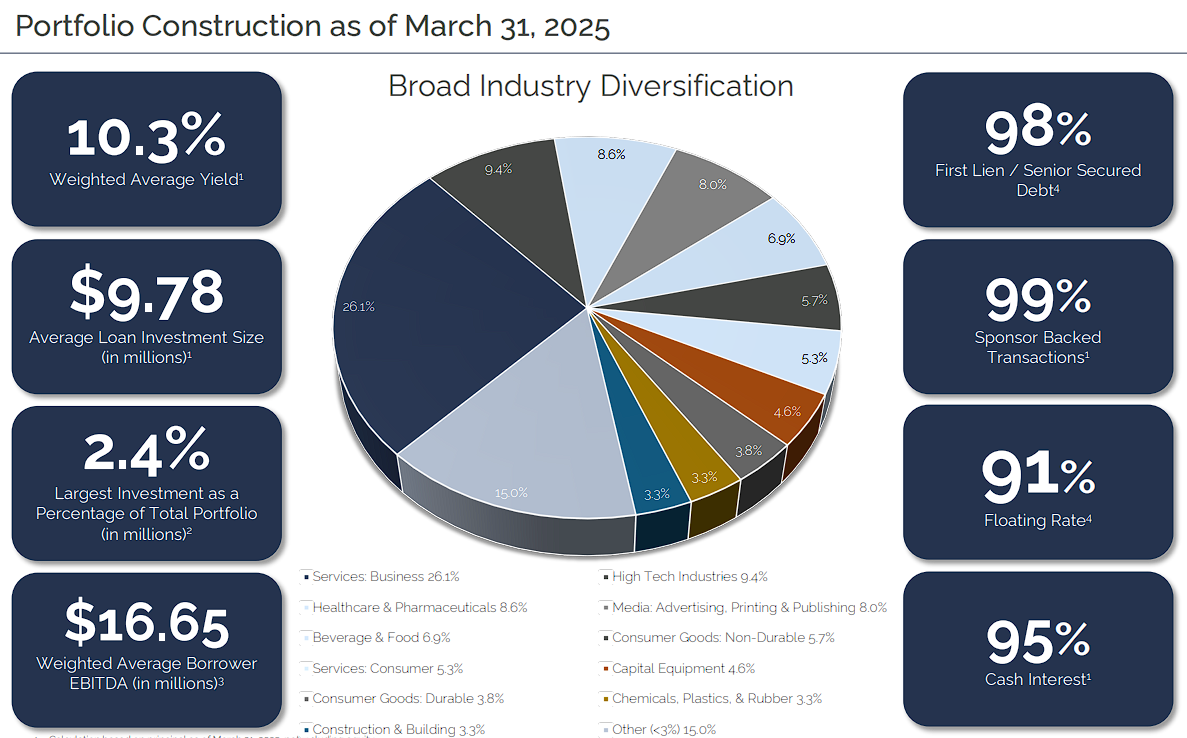
Stellus Capital Investment Corporation is an externally managed business development company that lends to private middle-market businesses.
Its portfolio is concentrated in first-lien and unitranche loans, with smaller holdings of second-lien debt and equity.
The company generally targets established businesses backed by private-equity sponsors, seeking current income while limiting losses through senior secured positions and portfolio diversification.
On May 11th, 2026, Stellus reported first-quarter investment income of $23.3 million, down from $25.0 million in the prior-year period.
Net investment income declined to $7.5 million, or $0.26 per share, from $9.8 million, or $0.35 per share. Core NII was $0.27 per share.
The decline reflected a smaller portfolio yield and higher financing costs, even as operating expenses were modestly lower. At quarter-end, investments at fair value totaled $990.0 million across 116 portfolio companies.
The weighted average yield on debt and other income-producing investments was 9.0%, down from 9.3% at year-end.
Net asset value slipped to $12.54 per share from $12.82. Stellus declared $0.34 per share of distributions during the quarter, exceeding both reported and core NII.
That gap does not automatically imply an immediate cut, but we believe it makes future portfolio deployment, realized income, and credit performance especially important for dividend sustainability.
Deep Dive: Click here to download our most recent Sure Analysis report on SCM.
Undervalued High Dividend Stock #14: AGNC Investment Corporation (AGNC)
P/E Ratio: 6.8
Dividend Yield: 13.3%
AGNC Investment is an internally managed mortgage REIT that invests primarily in Agency residential mortgage-backed securities on a leveraged basis. Because principal and interest are guaranteed by U.S. government-sponsored entities or agencies, direct credit risk is limited.
The main risks instead come from leverage, changes in interest rates, mortgage spreads, funding costs, and prepayment behavior.
On July 20th, 2026, AGNC reported second-quarter net and comprehensive income of $0.52 per share. Net spread and dollar roll income was $0.40 per share, compared with $0.42 in the prior quarter.
Tangible net book value increased 2.4% to $8.58 per share, and the company declared $0.36 per share of dividends. Together, the dividend and book-value gain produced a 6.7% quarterly economic return.
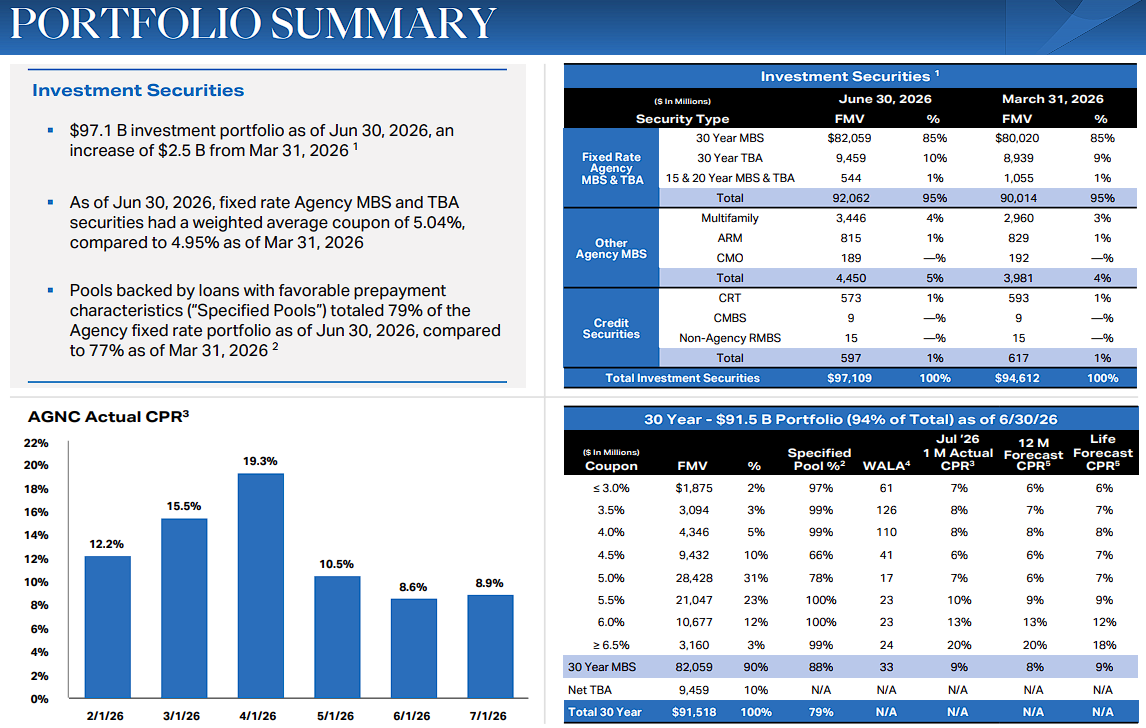
AGNC ended the quarter with tangible at-risk leverage of 7.4 times, unchanged sequentially, and $7.5 billion of unencumbered cash and Agency securities.
Mortgage spreads tightened during the quarter as elevated mortgage rates reduced expected supply while demand remained firm. This supported asset values despite a volatile macroeconomic environment.
The current dividend was covered by net spread and dollar roll income in the quarter, but that coverage can change quickly when funding costs, hedging results, or mortgage spreads move against the portfolio.
Deep Dive: Click here to download our most recent Sure Analysis report on AGNC.
Undervalued High Dividend Stock #13: PennantPark Floating Rate Capital Ltd. (PFLT)
P/NII Ratio: 6.6
Dividend Yield: 13.5%
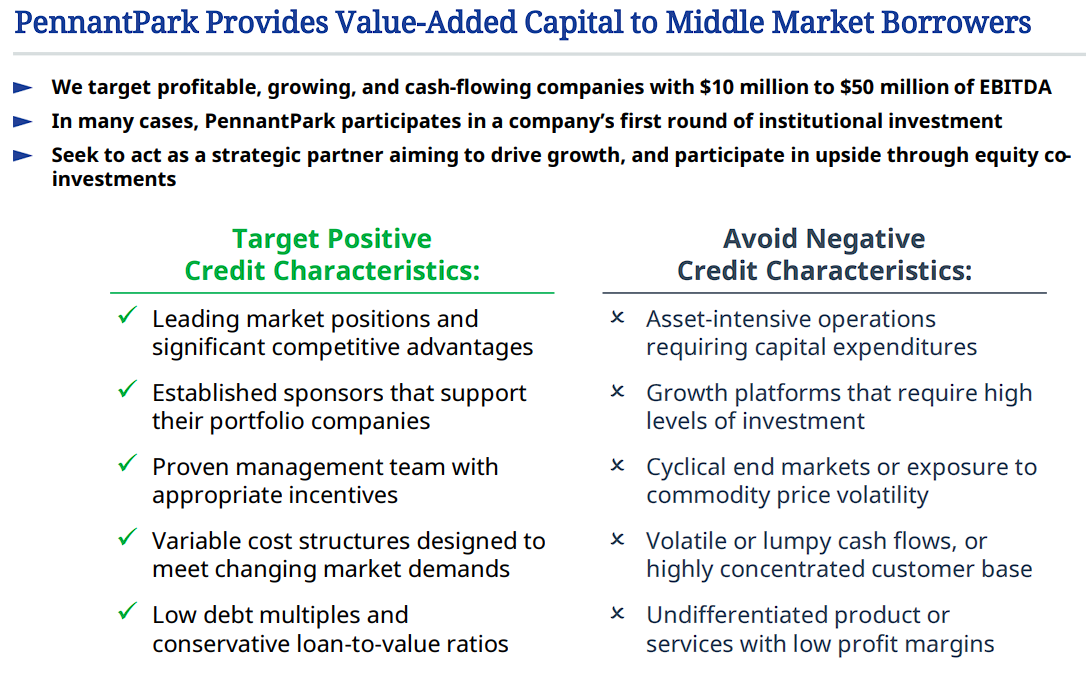
PennantPark Floating Rate Capital is a business development company focused primarily on first-lien, floating-rate loans to U.S. middle-market businesses.
The floating-rate structure helps investment income adjust with short-term rates, while senior secured positioning offers better downside protection than junior debt.
The company also invests through joint ventures, including the PennantPark Senior Secured Loan Funds.
On May 7th, 2026, PennantPark Floating Rate reported fiscal second-quarter investment income of $66.0 million, up from $61.9 million in the prior-year period as the debt portfolio expanded.
Net investment income was $25.7 million, or $0.26 per share, while core NII was $0.27 per share. The company declared approximately $0.31 per share of distributions during the quarter.
Portfolio purchases totaled $294.8 million, while sales and repayments were $328.0 million. The joint venture portfolio reached $1.21 billion and held investments in 120 companies.
Although the larger portfolio supported revenue growth, interest expense also increased as borrowings rose. Regular quarterly distributions exceeded both GAAP and core NII, leaving limited coverage from recurring earnings.
PennantPark’s floating-rate, first-lien emphasis remains attractive for income generation, but leverage, credit losses, and the difference between earnings and the payout are the most important items to watch.
Deep Dive: Click here to download our most recent Sure Analysis report on PFLT.
Undervalued High Dividend Stock #12: Horizon Technology Finance Corporation (HRZN)
P/NII Ratio: 6.3
Dividend Yield: 15.6%
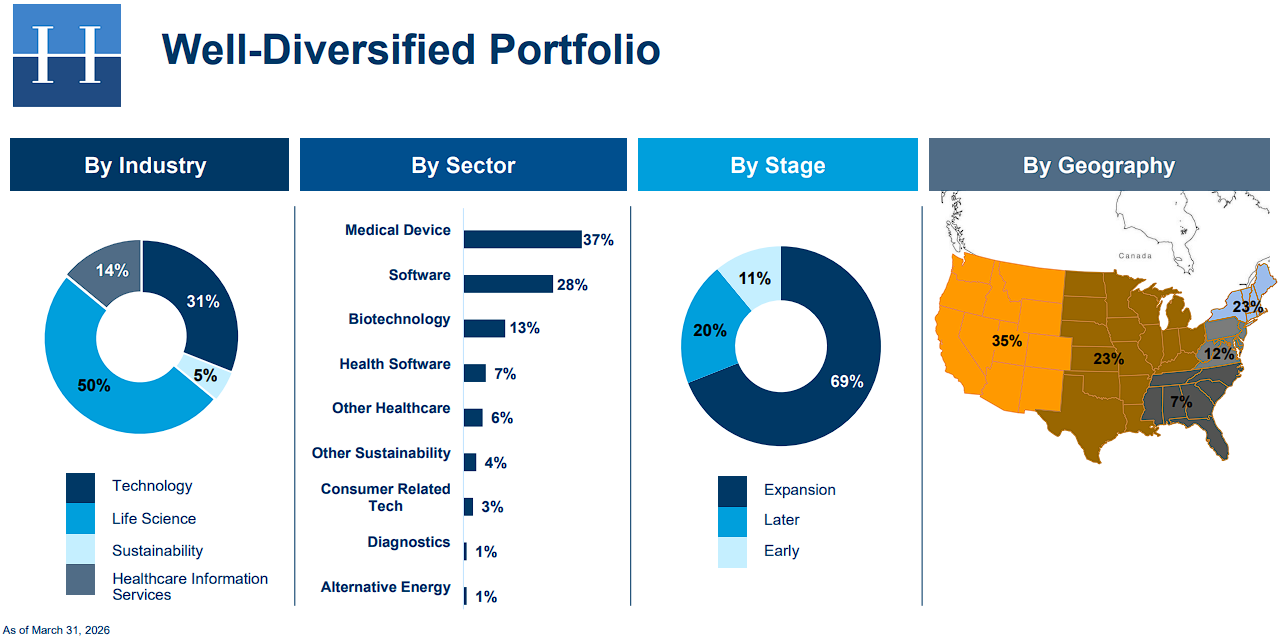
Horizon Technology Finance is a business development company specializing in venture debt. It provides secured loans to development-stage companies in technology, life sciences, healthcare information technology, and sustainability.
These loans often include warrants that can generate additional gains, but borrowers may be unprofitable and reliant on continued access to outside capital.
On May 5th, 2026, Horizon reported first-quarter total investment income of $24.1 million, slightly below $24.5 million a year earlier. Net investment income declined to $9.0 million, or $0.19 per share, from $10.7 million, or $0.27 per share.
Net asset value was $6.98 per share, and the debt portfolio produced a 15.2% yield. Horizon ended the quarter with a committed backlog of $180 million.
The most important recent development was the April completion of Horizon’s merger with Monroe Capital Corporation, which expanded the platform and integrated it into the broader Monroe Capital organization.
The combination should provide greater scale and diversification, but integration and portfolio credit remain significant considerations.
Horizon also recorded $6.2 million of realized and unrealized losses during the quarter, while declared distributions totaled only $0.18 per share.
The high portfolio yield can support high income, yet NAV pressure and the venture-backed borrower base explain why the stock’s dividend yield remains elevated.
Deep Dive: Click here to download our most recent Sure Analysis report on HRZN.
Undervalued High Dividend Stock #11: Saratoga Investment Corp. (SAR)
P/NII Ratio: 5.8
Dividend Yield: 15.4%
Saratoga Investment is a business development company that provides debt and equity financing to U.S. middle-market companies.
Its portfolio is concentrated in first-lien loans, supplemented by second-lien debt, structured finance securities, and equity investments.
Saratoga also manages an SBA-licensed subsidiary, giving it access to long-term financing that can help support returns.
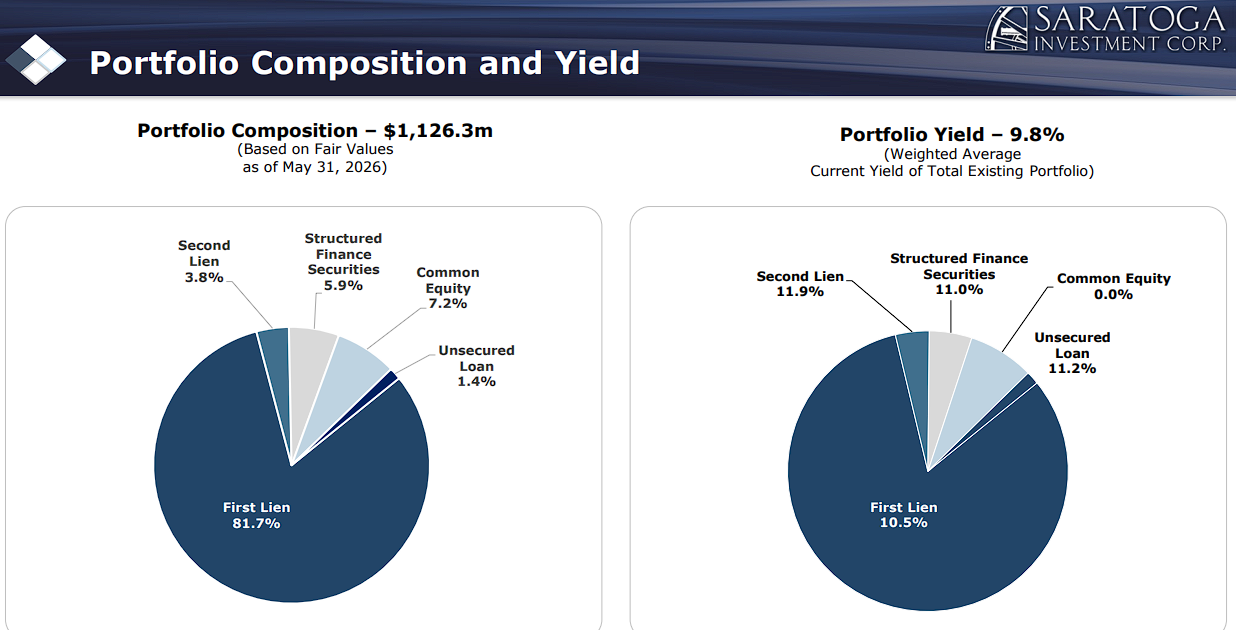
On July 7th, 2026, Saratoga reported fiscal first-quarter 2027 results for the period ending May 31st, 2026.
Total investment income declined 4.8% year over year to $30.8 million. Net investment income was $7.6 million, or $0.47 per share, down from $0.66 per share a year earlier.
Lower short-term rates and tighter spreads weighed on income, although assets under management increased 16.3% year over year to $1.13 billion.
Net asset value fell to $23.23 per share from $24.42 in the previous quarter, largely reflecting $15.2 million of unrealized depreciation.
On the positive side, non-accruals declined to zero at fair value, and the company generated $31 million of net originations.
Saratoga declared a base monthly dividend of $0.25 per share, or $0.75 for the quarter.
That payout materially exceeded quarterly NII, so dividend support may depend on accumulated taxable income, portfolio realizations, or improved earnings.
Deep Dive: Click here to download our most recent Sure Analysis report on SAR.
Undervalued High Dividend Stock #10: ARMOUR Residential REIT, Inc. (ARR)
P/E Ratio: 5.5
Dividend Yield: 17.5%
ARMOUR Residential REIT is an externally managed mortgage REIT that invests primarily in fixed-rate Agency residential mortgage-backed securities.
Its assets carry limited direct credit risk because they are issued or guaranteed by government-sponsored entities or Ginnie Mae.
However, the portfolio is heavily leveraged, making book value and earnings sensitive to mortgage spreads, financing costs, hedging, and prepayments.
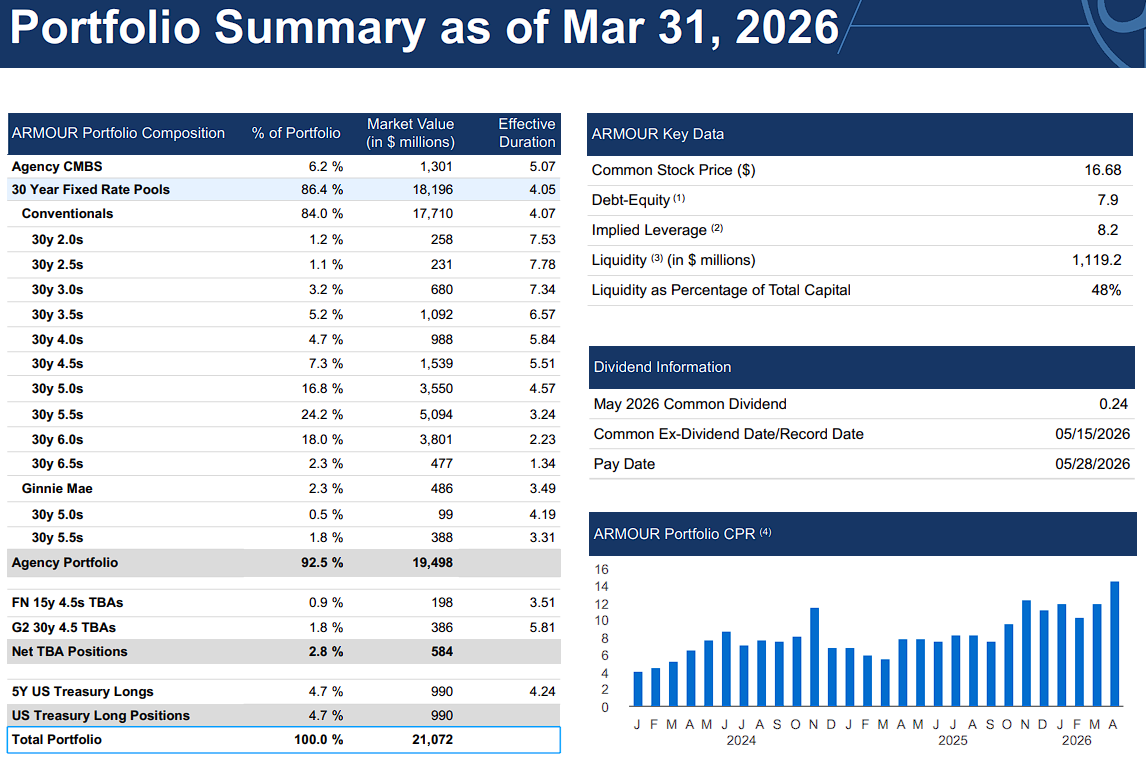
On April 22nd, 2026, ARMOUR reported first-quarter distributable earnings available to common shareholders of $90.5 million, or $0.76 per share. This covered the $0.72 of common dividends paid during the quarter.
Net interest income was $70.7 million, but GAAP results included a $58.0 million loss attributable to common shareholders as mortgage-backed securities declined in value.
Book value ended the quarter at $17.42 per share, down 6.5% from year-end. Including dividends, total economic return was negative 2.6%.
The portfolio totaled $21.1 billion, with 92.5% invested in Agency mortgage-backed securities, and implied leverage was 8.21 times equity.
ARMOUR also raised $215.3 million through its at-the-market program during the quarter, substantially increasing the share count.
The monthly payout remains supported by distributable earnings for now, but repeated equity issuance, high leverage, and book-value volatility make this one of the riskier income stocks in the ranking.
Deep Dive: Click here to download our most recent Sure Analysis report on ARR.
Undervalued High Dividend Stock #9: Ellington Credit Company (EARN)
P/E Ratio: 5.5
Dividend Yield: 22.0%
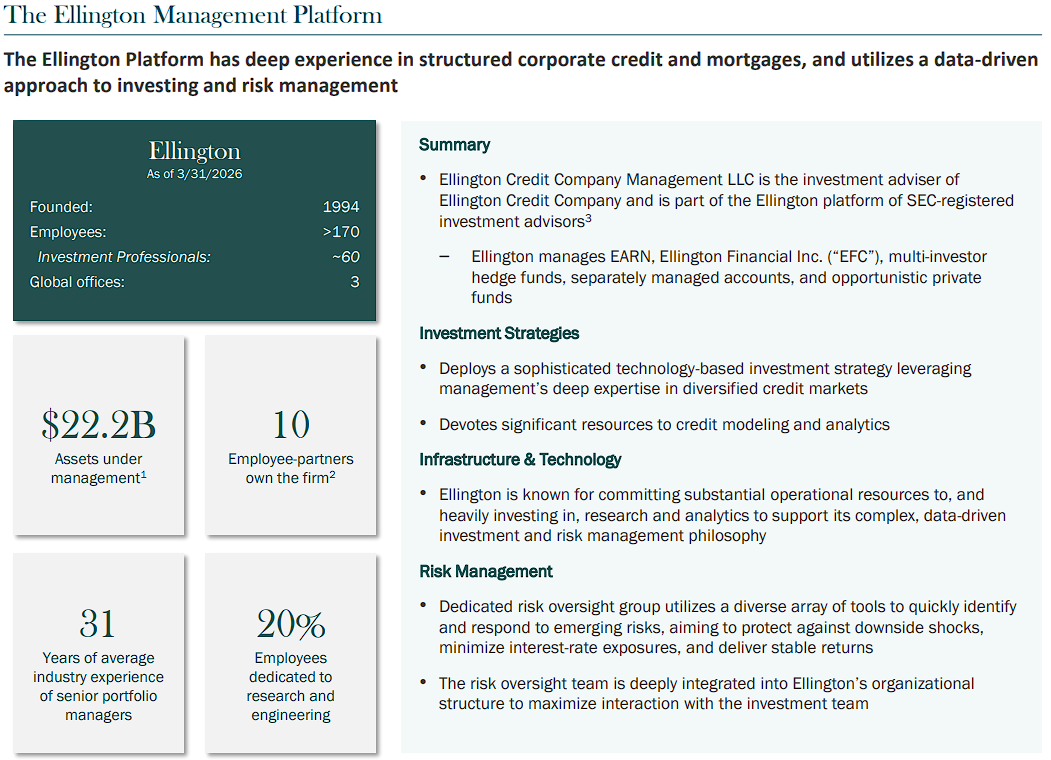
Ellington Credit Company is an investment company focused on collateralized loan obligations after transitioning away from its former mortgage-REIT strategy.
Its portfolio now contains both CLO debt and CLO equity. Debt tranches generally provide more stable contractual income, while equity tranches can produce much higher cash returns but absorb losses first when underlying leveraged loans weaken.
On May 19th, 2026, Ellington Credit reported results for its fiscal fourth quarter ended March 31st. Net asset value was $4.09 per share after $0.24 of quarterly distributions.
The company posted a GAAP net loss of $32.3 million, or $0.86 per share, as unrealized losses in CLO equity more than offset investment income and trading gains.
Net investment income was $5.1 million, or $0.13 per share, while adjusted NII was $7.3 million, or $0.19 per share.
The CLO portfolio had a fair value of $307.9 million, split between $145.1 million of debt investments and $162.8 million of equity investments.
It generated $17.4 million of recurring cash distributions during the quarter, but market-value losses drove a negative result.
Ellington continued to declare monthly dividends of $0.08 per share.
The portfolio’s projected yields are high, but the recent NAV decline illustrates the volatility and structural leverage embedded in CLO equity.
Deep Dive: Click here to download our most recent Sure Analysis report on EARN.
Undervalued High Dividend Stock #8: Oxford Square Capital Corp. (OXSQ)
P/NII Ratio: 4.9
Dividend Yield: 28.6%
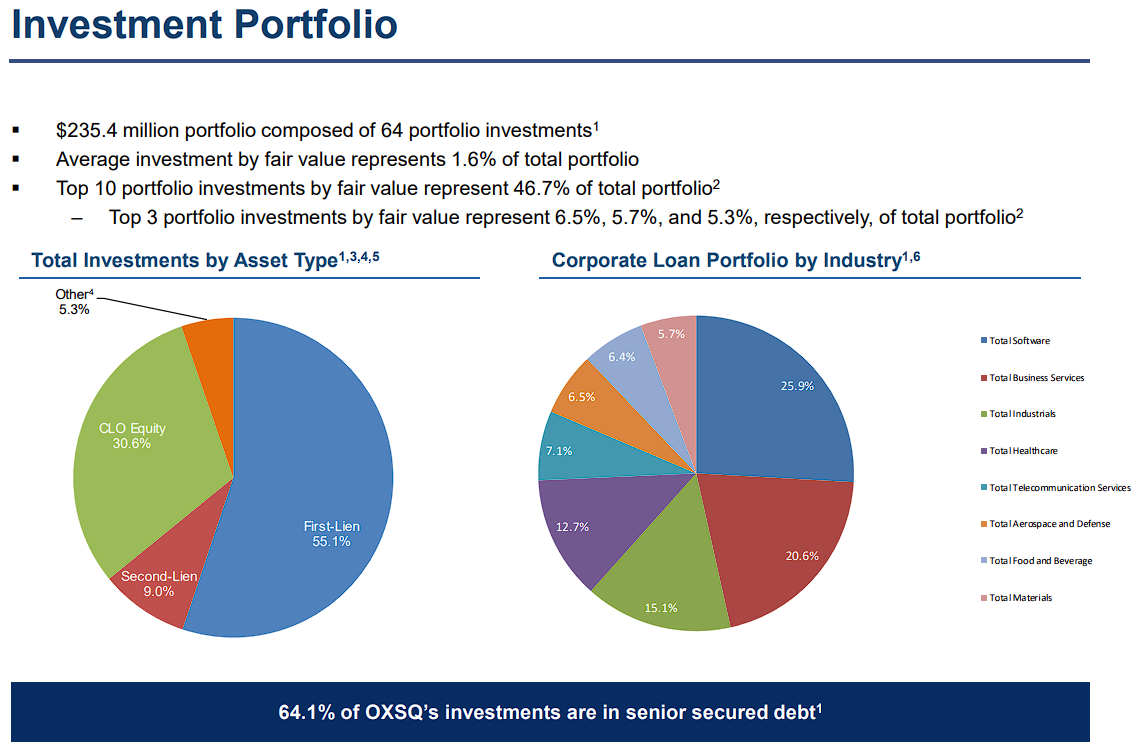
Oxford Square Capital is a business development company that invests in senior secured loans and collateralized loan obligation equity.
The debt portfolio generates contractual interest income, while CLO equity can produce high cash distributions when underlying loan performance is healthy.
That mix also creates meaningful volatility, since CLO equity is leveraged and sits at the bottom of the securitization capital structure.
On April 29th, 2026, Oxford Square reported first-quarter net investment income of $4.1 million, or $0.05 per share, down from $5.4 million, or $0.07 per share, in the previous quarter.
Net asset value fell sharply to $1.32 per share from $1.69 at year-end. The company recorded a $25.5 million decrease in net assets from operations, including $30.7 million of realized losses.
Credit issues also remained visible. One debt investment with a fair value of $3.5 million and one preferred-equity investment valued at $5.2 million were on non-accrual.
Oxford Square issued 7.2 million shares through its at-the-market program for $12.3 million of net proceeds, which increased capital but also diluted existing shareholders. T
he board declared monthly dividends of $0.035 per share for July through September. The indicated yield is exceptionally high, but NII did not cover the quarterly payout and NAV deterioration remains the central concern.
Deep Dive: Click here to download our most recent Sure Analysis report on OXSQ.
Undervalued High Dividend Stock #7: Prospect Capital Corporation (PSEC)
P/NII Ratio: 4.7
Dividend Yield: 19.3%
Prospect Capital is a large business development company that provides debt and equity capital to privately held U.S. middle-market businesses.
Its portfolio includes first- and second-lien loans, equity investments, and a real estate strategy operated through National Property REIT.
This diversification creates several income sources, though the structure is more complex than that of a traditional senior-loan BDC.
On May 7th, 2026, Prospect reported fiscal third-quarter net investment income of $78.5 million, or $0.16 per share, down from $0.19 in both the previous quarter and the prior-year period.
Net asset value declined to $6.05 per share from $6.21 at the end of December and $7.25 a year earlier.
The company declared distributions of $0.135 per share during the quarter, so NII still covered the payout.
The investment portfolio totaled about $6.3 billion at fair value across 89 companies. Senior secured debt represented 76.3% of fair value, while non-accrual loans were 0.7% of total assets.
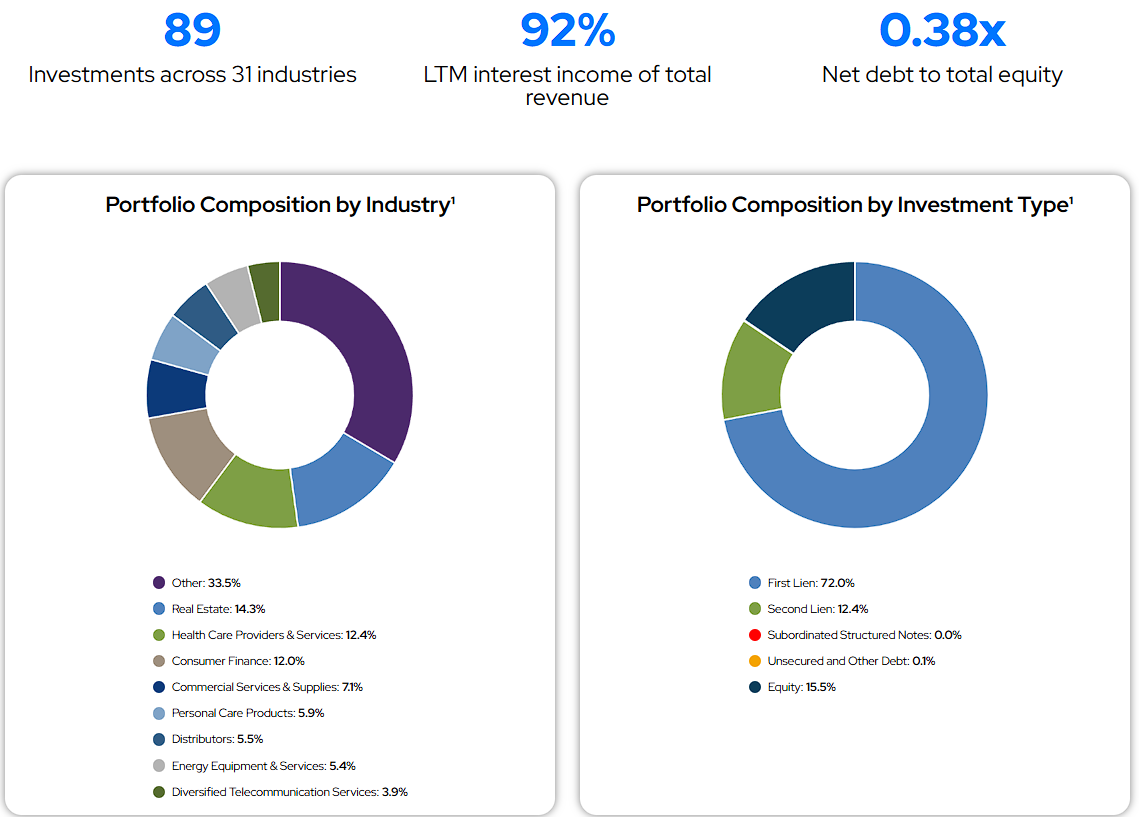
Prospect also announced the proposed $328 million sale of Valley Electric, which was expected to generate a 4.8-times multiple of invested capital over the life of the investment.
The realization is encouraging, but persistent NAV erosion and the use of substantial perpetual preferred stock remain important considerations.
Deep Dive: Click here to download our most recent Sure Analysis report on PSEC.
Undervalued High Dividend Stock #6: Orchid Island Capital, Inc. (ORC)
P/E Ratio: 4.7
Dividend Yield: 17.7%
Orchid Island Capital is an externally managed mortgage REIT that invests almost entirely in Agency residential mortgage-backed securities.
The company finances its portfolio primarily through repurchase agreements and uses derivatives to manage interest-rate exposure.
Agency guarantees reduce credit risk, but substantial leverage creates pronounced sensitivity to mortgage spreads, financing markets, and hedging results.
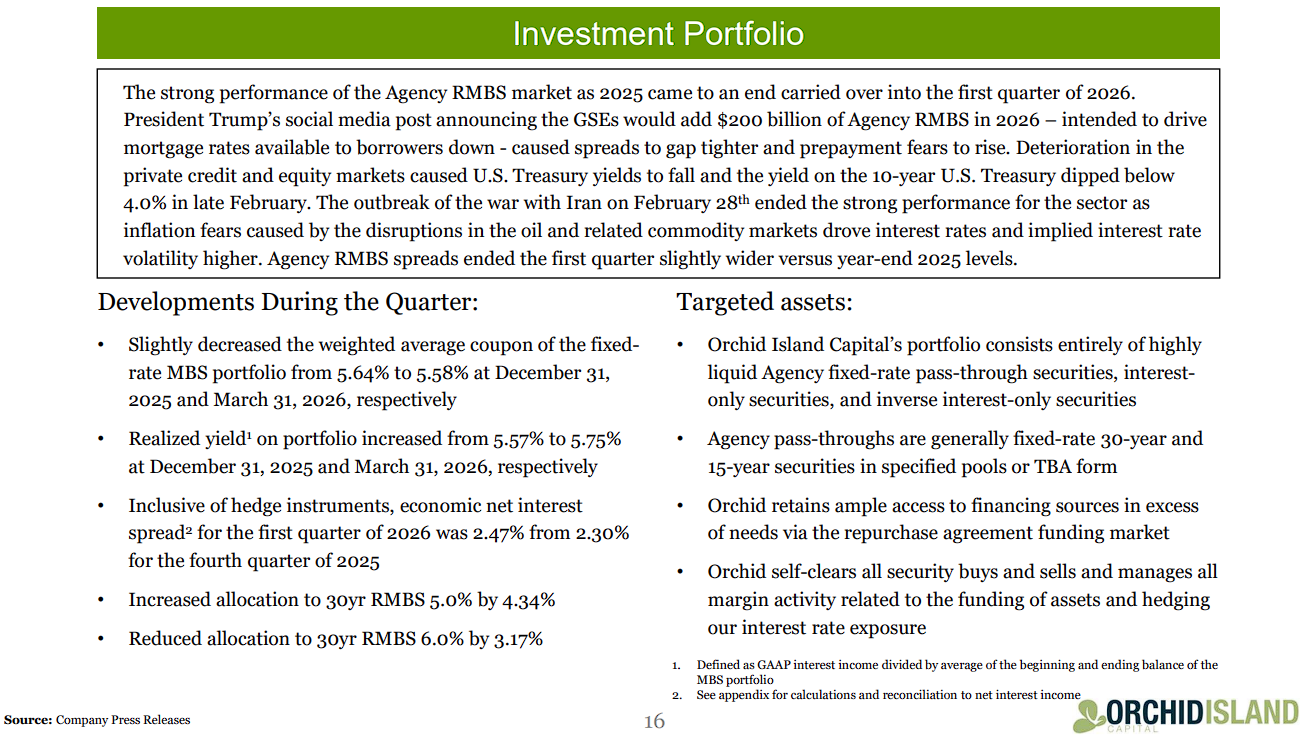
On July 13th, 2026, Orchid released preliminary estimates for the second quarter. Book value was estimated at $7.22 per share as of June 30th, up $0.14 during the quarter.
Estimated GAAP net income was $0.44 per share, including $0.18 of net realized and unrealized gains on mortgage securities and derivative instruments. Orchid estimated a 6.2% quarterly total return on equity.
The company declared $0.30 per share of dividends during the quarter, equal to its regular $0.10 monthly rate. Common shares outstanding increased to 199.6 million at June 30th from 196.7 million at the end of March, reflecting continued equity issuance.
The preliminary figures suggest that the portfolio performed well during the quarter and that book-value gains supplemented the dividend.
Still, management emphasized that the estimates remain subject to change.
Orchid’s double-digit yield is attractive, but investors should expect book value and reported earnings to fluctuate materially as mortgage spreads and interest rates change.
Deep Dive: Click here to download our most recent Sure Analysis report on ORC.
Undervalued High Dividend Stock #5: Invesco Mortgage Capital Inc. (IVR)
P/E Ratio: 4.0
Dividend Yield: 18.1%
Invesco Mortgage Capital is an externally managed mortgage REIT advised by Invesco.
It invests primarily in Agency residential and commercial mortgage-backed securities, including specified pools and TBA positions.
The portfolio carries little direct credit risk, but its leveraged structure leaves results highly sensitive to funding costs, interest rates, mortgage spreads, and prepayment assumptions.
On May 6th, 2026, Invesco Mortgage Capital reported a first-quarter net loss of $0.28 per common share, compared with net income of $0.68 in the previous quarter.
Earnings available for distribution were $0.55 per share, while the company declared $0.36 per share of dividends.
Book value declined to $8.08 per share from $8.72 at year-end, producing a negative quarterly economic return of 3.2%.
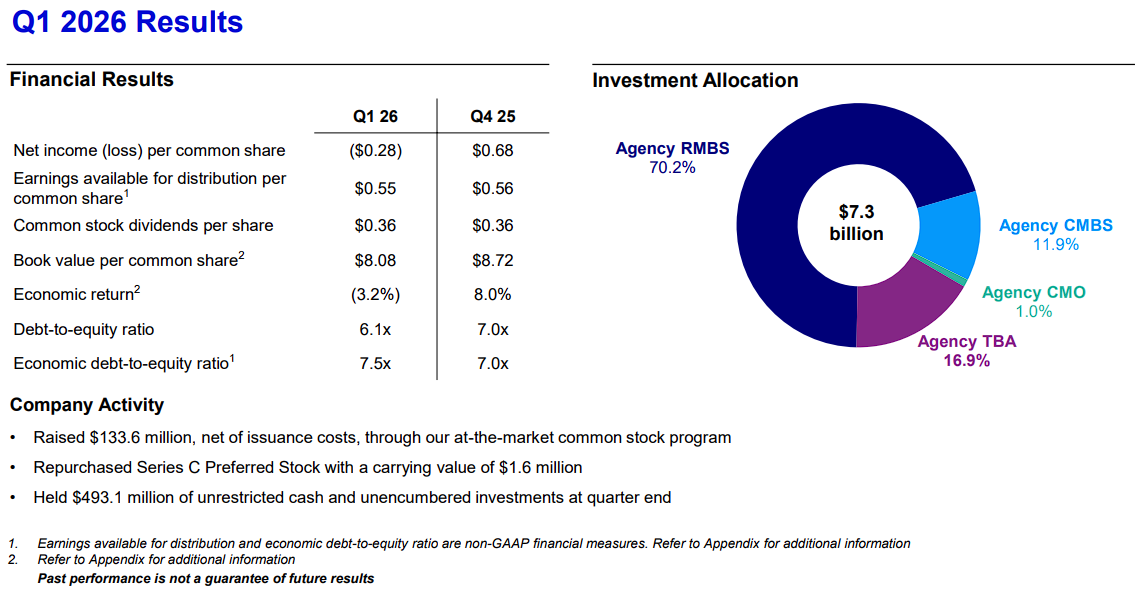
The investment portfolio totaled $7.3 billion, including $5.2 billion of Agency residential mortgage-backed securities, $1.2 billion of Agency TBA securities, and $0.9 billion of Agency commercial mortgage-backed securities.
Economic leverage was 7.5 times equity, and unrestricted cash plus unencumbered investments totaled $493.1 million.
Distributable earnings covered the dividend in the quarter, but the reduction in book value shows the cost of spread volatility.
The stock’s high yield therefore comes with meaningful risk of capital losses and future payout adjustments.
Deep Dive: Click here to download our most recent Sure Analysis report on IVR.
Undervalued High Dividend Stock #4: CION Investment Corporation (CION)
P/NII Ratio: 3.5
Dividend Yield: 19.4%
CION Investment Corporation is an externally managed business development company that lends primarily to private U.S. middle-market businesses.
The portfolio is built around senior secured first-lien loans, with smaller equity and structured-product positions.
CION seeks current income and capital preservation, while its floating-rate loans allow portfolio income to adjust with short-term interest rates.
On May 7th, 2026, CION reported first-quarter total investment income of $49.5 million, down from $53.8 million in the previous quarter.
Net investment income fell to $12.9 million, or $0.25 per share, from $0.35 per share, as lower transaction and dividend income combined with higher interest expense.
Net asset value declined 4.7% to $13.11 per share due primarily to unrealized mark-to-market adjustments.
At quarter-end, CION held $1.70 billion of investments across 89 companies and 23 industries. First-lien debt represented 80.8% of the portfolio, while investments on non-accrual were 1.53% at fair value.
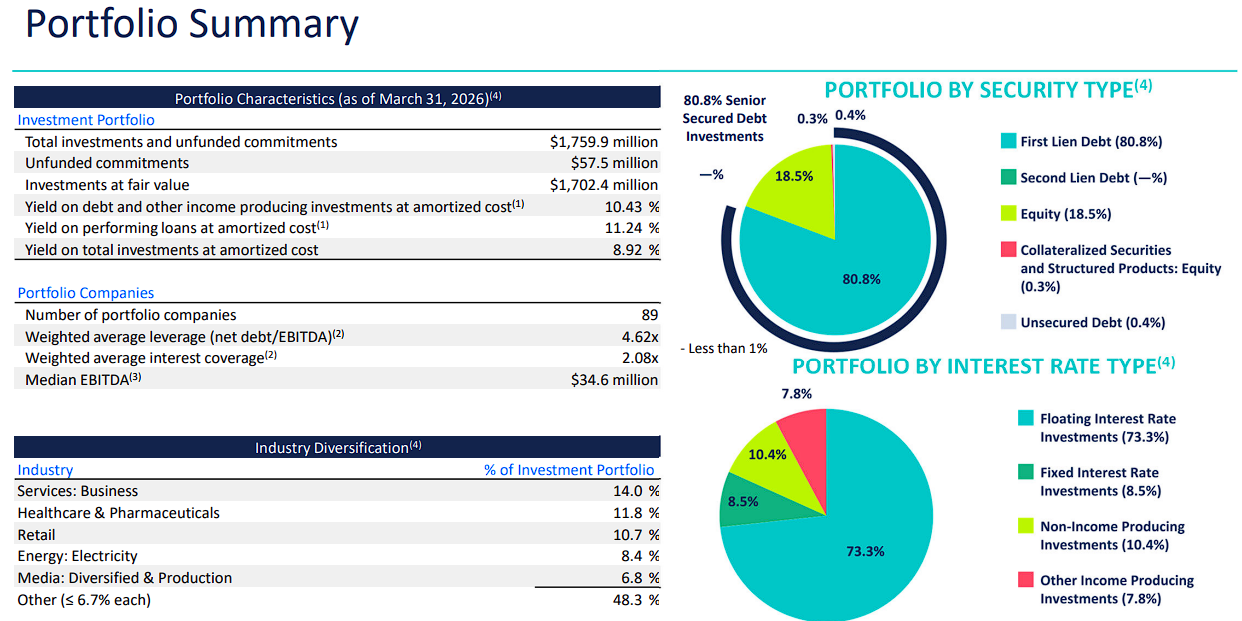
The company repurchased $9.7 million of shares during the quarter and declared monthly distributions of $0.10 per share for July, August, and September.
The portfolio remains defensively positioned, but quarterly NII did not cover the $0.30 quarterly distribution rate, and net leverage increased to 1.62 times equity
Deep Dive: Click here to download our most recent Sure Analysis report on CION.
Undervalued High Dividend Stock #3: PennantPark Investment Corporation (PNNT)
P/E Ratio: 3.5
Dividend Yield: 28.9%
PennantPark Investment Corporation is a business development company that provides private credit and selected equity capital to U.S. core middle-market businesses.
It invests across first-lien, second-lien, subordinated debt, and equity, giving it more upside potential than a pure senior-loan BDC but also exposing shareholders to greater portfolio volatility.
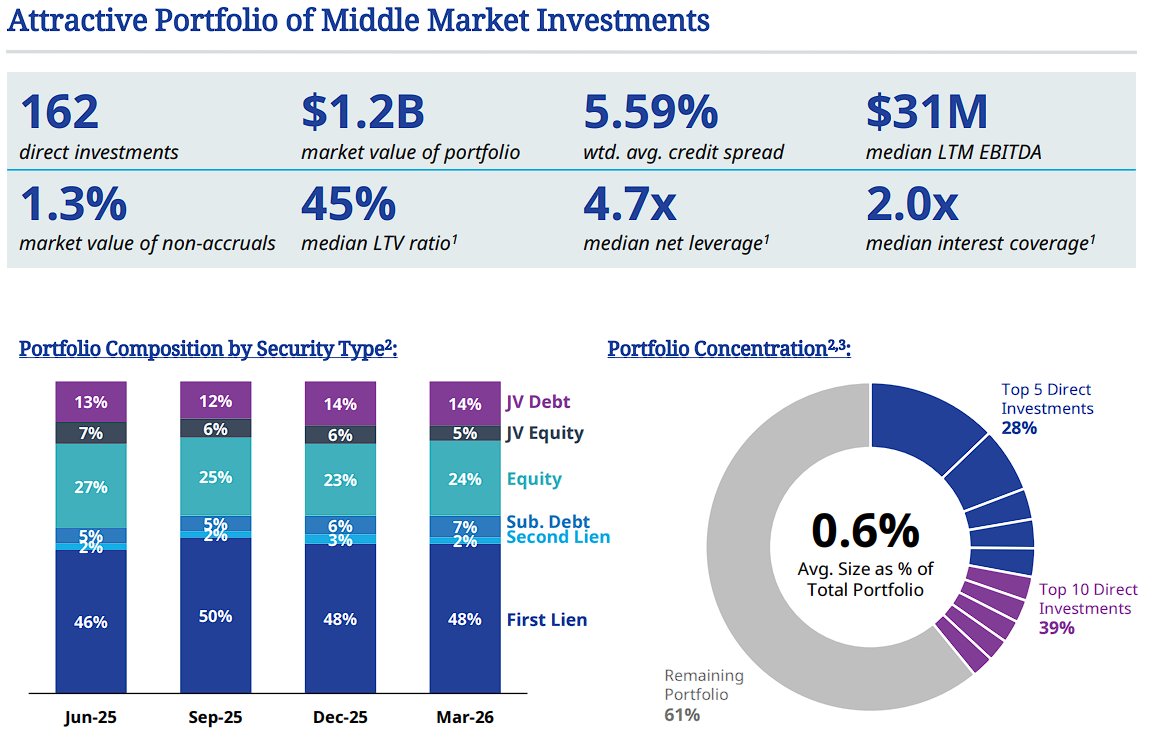
On May 7th, 2026, PennantPark reported fiscal second-quarter investment income of $24.9 million, down from $30.7 million in the prior-year period.
Net investment income fell to $9.3 million, or $0.14 per share, from $0.18 per share. The decline reflected a smaller investment portfolio and a lower weighted average yield on debt investments.
The portfolio totaled $1.20 billion at fair value and carried a 10.9% weighted average debt yield.
Net asset value declined 3.9% during the quarter to $6.73 per share, partly because of $12.2 million in unrealized depreciation.
PennantPark declared $0.20 per share of base distributions and $0.04 of supplemental distributions during the quarter, well above NII.
It has since maintained a monthly base distribution structure, but recurring earnings coverage remains weak.
The company’s equity exposure and joint-venture assets can create future gains, yet the very high current yield reflects legitimate concerns regarding NAV stability and the sustainability of supplemental payments.
Deep Dive: Click here to download our most recent Sure Analysis report on PNNT.
Undervalued High Dividend Stock #2: Shutterstock, Inc. (SSTK)
P/E Ratio: 2.9
Dividend Yield: 19.6%
Shutterstock operates a global platform for licensing photographs, videos, music, illustrations, three-dimensional models, and other creative content.
It serves businesses, media organizations, and individual creators through subscriptions and transactional purchases.
The company has also expanded into data licensing and services, including content used to train and support artificial-intelligence models.
On May 5th, 2026, Shutterstock reported first-quarter revenue of $199.2 million, down 18% from $242.6 million a year earlier.
Content revenue fell 12% due mainly to weaker new-customer acquisition, while Data, Distribution, and Services revenue declined 47% because of the timing of metadata licenses.
Adjusted EBITDA dropped 33% to $42.7 million, and adjusted earnings fell to $0.58 per share from $1.03. The company recorded a GAAP loss of $47.6 million, or $1.34 per share, reflecting weaker revenue as well as investment losses, legal contingency costs, and workforce-optimization expenses.
The biggest recent development came in July, when Getty Images abandoned its proposed merger with Shutterstock and the U.K. Competition and Markets Authority canceled its inquiry.
Shutterstock must therefore proceed as a standalone company.
Its low SARD P/E and unusually high yield appear compelling, but declining operating results and the loss of the merger catalyst make the dividend and turnaround execution important to monitor.
Deep Dive: Click here to download our most recent Sure Analysis report on SSTK.
Undervalued High Dividend Stock #1: BCP Investment Corporation (BCIC)
P/NII Ratio: 2.9
Dividend Yield: 15.0%
BCP Investment Corporation is an externally managed business development company that lends to and invests in U.S. middle-market businesses.
Formerly known as Portman Ridge Finance Corporation, it operates under a BC Partners-affiliated adviser and has expanded through several BDC mergers.
Its portfolio includes first- and second-lien loans, subordinated debt, equity investments, and selected joint-venture exposures.
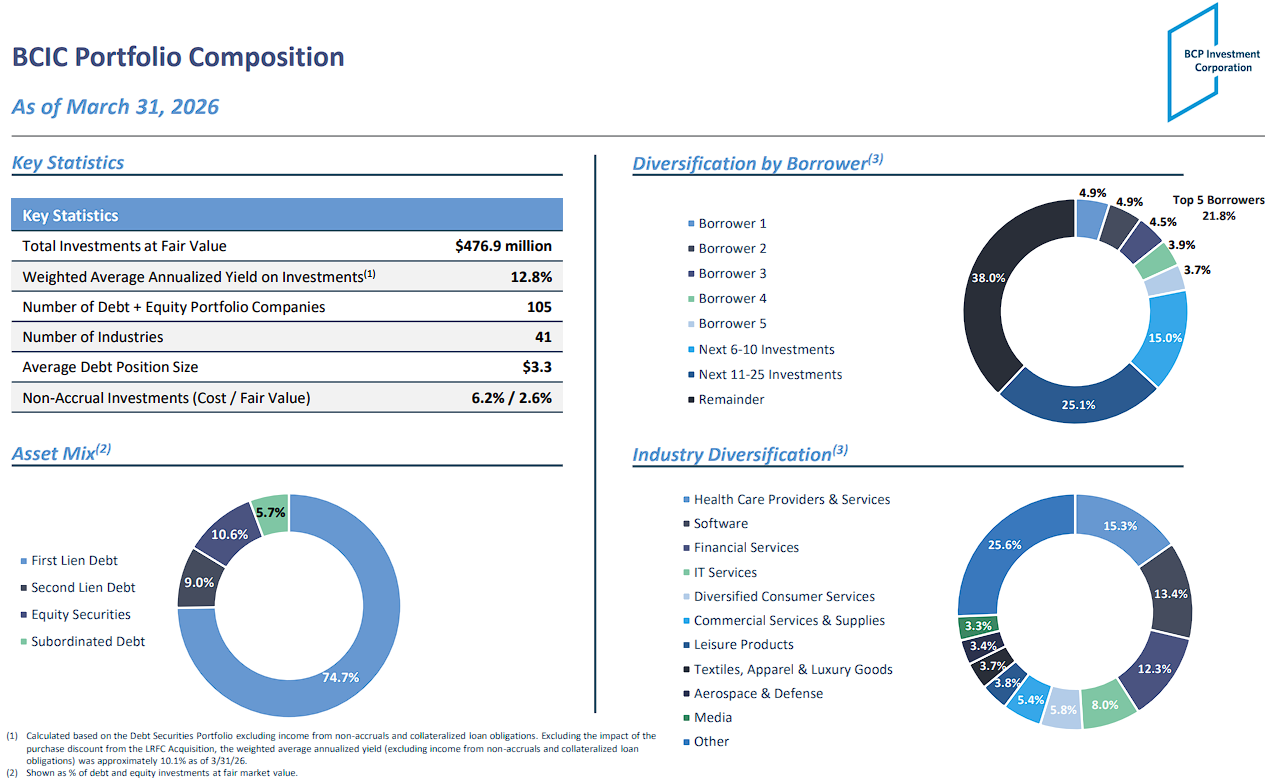
On May 7th, 2026, BCP Investment reported first-quarter total investment income of $17.6 million, slightly above $17.5 million in the previous quarter.
Net investment income was $6.9 million, or $0.55 per share, compared with $0.57 per share in the fourth quarter.
Net asset value declined to $15.60 per share from $16.68, with software and software-exposed investments accounting for much of the unrealized markdowns.
Non-accruals improved to 2.6% of the portfolio at fair value from 4.0% at year-end.
The company also repurchased 172,159 shares for $2.1 million at an average price of $11.97, adding approximately $0.07 per share to NAV.
BCP transitioned its base distribution from quarterly to monthly and announced a $0.27 third-quarter base payout, plus a $0.03 supplemental distribution for the second quarter.
Earnings cover the base distribution, but ongoing NAV declines and credit performance remain the main risks.
Deep Dive: Click here to download our most recent Sure Analysis report on BCIC.
Final Thoughts
All the above stocks are trading at remarkably cheap valuation levels, with price-to-earnings (or similar) ratios of less than 10.0.
But they tend to be cheap for a reason. Many of these securities come with elevated risk levels.
On the positive side, not only are these securities cheap based on earnings (or similar), they are also rewarding shareholders with dividends. And with yields north of 5.0%, it’s much easier for investors to wait patiently for business headwinds to (hopefully) subside.
If you are interested in finding high-quality dividend growth stocks and/or other high-yield securities and income securities, the following Sure Dividend resources will be useful:
Thanks for reading this article. Please send any feedback, corrections, or questions to [email protected].