

Updated on November 7th, 2025 by Bob Ciura
Monthly dividend stocks have instant appeal for many income investors. Stocks that pay their dividends each month offer more frequent payouts than traditional quarterly or semi-annual dividend payers.
For this reason, we created a full list of 83 monthly dividend stocks.
You can download our full Excel spreadsheet of all monthly dividend stocks (along with metrics that matter like dividend yield and payout ratio) by clicking on the link below:

In addition, stocks that have high dividend yields are also attractive for income investors.
With the average S&P 500 yield hovering around 1.3%, investors can generate much more income with high-yield stocks. Screening for monthly dividend stocks that also have high dividend yields makes for an appealing combination.
This article will list the 20 highest-yielding monthly dividend stocks.
Table Of Contents
The following 20 monthly dividend stocks have high dividend yields above 5%. Stocks are listed by their dividend yields, from lowest to highest.
The list excludes oil and gas royalty trust, which have extreme fluctuations in their dividend payouts from one quarter to the next due to the underlying volatility of commodity prices.
You can instantly jump to an individual section of the article by utilizing the links below:
High-Yield Monthly Dividend Stock #20: Atrium Mortgage Investment Corp. (AMIVF)
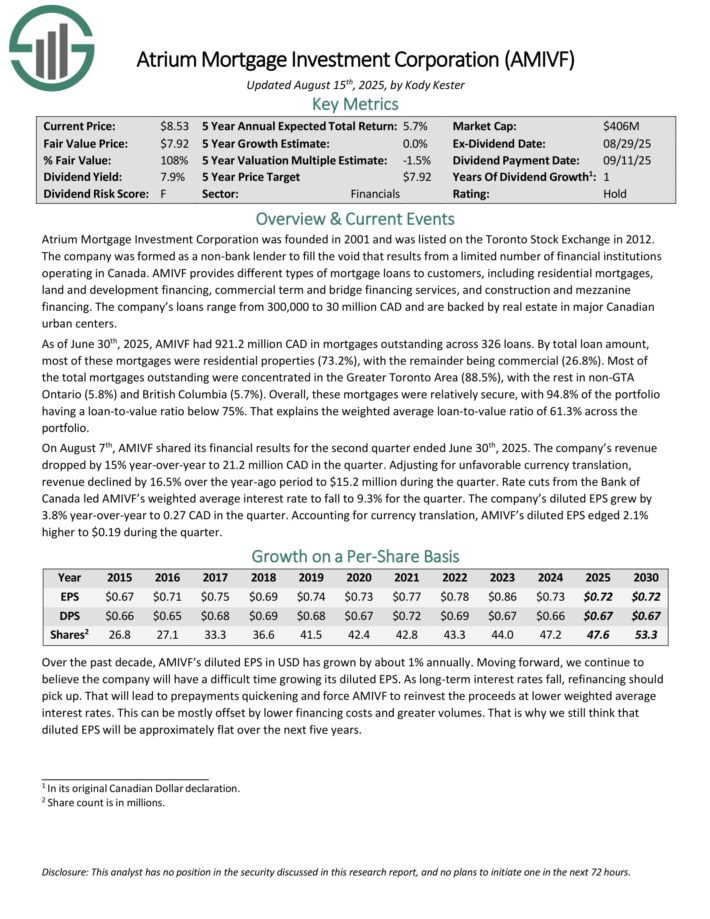
Atrium Mortgage Investment Corporation was founded in 2001 and was listed on the Toronto Stock Exchange in 2012. AMIVF provides different types of mortgage loans to customers, including residential mortgages, land and development financing, commercial term and bridge financing services, and construction and mezzanine financing.
The company’s loans range from 300,000 to 30 million CAD and are backed by real estate in major Canadian urban centers. As of June 30th, 2025, AMIVF had 921.2 million CAD in mortgages outstanding across 326 loans.
By total loan amount, most of these mortgages were residential properties (73.2%), with the remainder being commercial (26.8%).
Most of the total mortgages outstanding were concentrated in the Greater Toronto Area (88.5%), with the rest in non GTA Ontario (5.8%) and British Columbia (5.7%).
Overall, these mortgages were relatively secure, with 94.8% of the portfolio having a loan-to-value ratio below 75%. That explains the weighted average loan-to-value ratio of 61.3% across the portfolio.
On August 7th, AMIVF shared its financial results for the second quarter ended June 30th, 2025. The company’s revenue dropped by 15% year-over-year to 21.2 million CAD in the quarter.
Adjusting for unfavorable currency translation, revenue declined by 16.5% over the year-ago period to $15.2 million during the quarter.
Rate cuts from the Bank of Canada led AMIVF’s weighted average interest rate to fall to 9.3% for the quarter. The company’s diluted EPS grew by 3.8% year-over-year to 0.27 CAD in the quarter.
Click here to download our most recent Sure Analysis report on AMIVF (preview of page 1 of 3 shown below):
High-Yield Monthly Dividend Stock #19: SIR Royalty Income Fund (SIRZF)
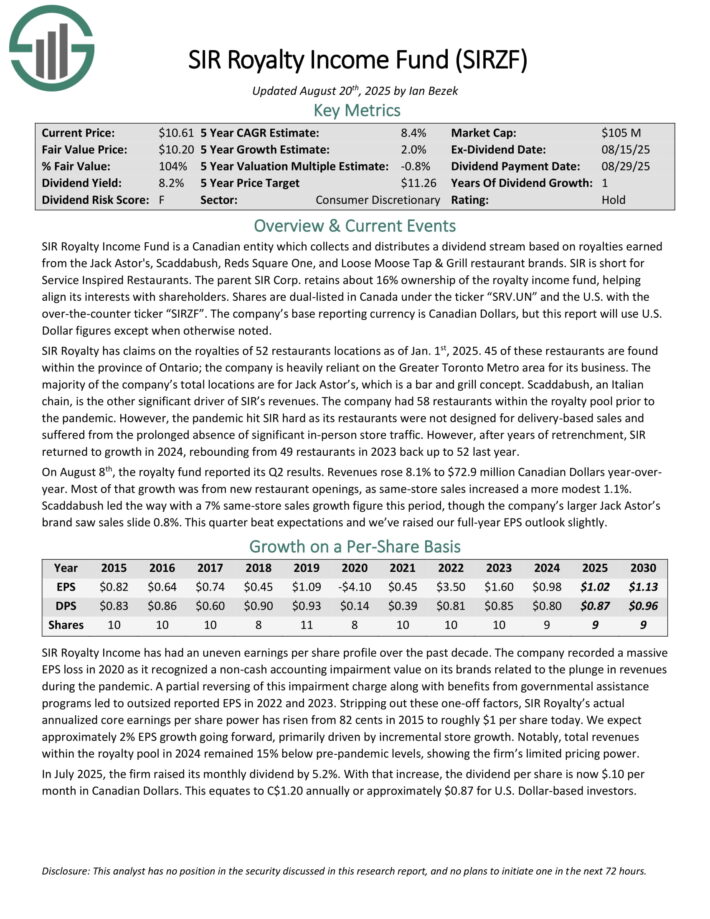
SIR Royalty Income Fund is a Canadian entity which collects and distributes a dividend stream based on royalties earned from the Jack Astor’s, Scaddabush, Reds Square One, and Loose Moose Tap & Grill restaurant brands.
The parent SIR Corp. retains about 16% ownership of the royalty income fund, helping align its interests with shareholders.
SIR Royalty has claims on the royalties of 52 restaurants locations as of Jan. 1st, 2025. 45 of these restaurants are found within the province of Ontario; the company is heavily reliant on the Greater Toronto Metro area for its business.
The majority of the company’s total locations are for Jack Astor’s, which is a bar and grill concept. Scaddabush, an Italian chain, is the other significant driver of SIR’s revenues.
On August 8th, the royalty fund reported its Q2 results. Revenues rose 8.1% to $72.9 million Canadian Dollars year-over-year. Most of that growth was from new restaurant openings, as same-store sales increased a more modest 1.1%.
Scaddabush led the way with a 7% same-store sales growth figure this period, though the company’s larger Jack Astor’s brand saw sales slide 0.8%.
Click here to download our most recent Sure Analysis report on SIRZF (preview of page 1 of 3 shown below):
High-Yield Monthly Dividend Stock #18: InPlay Oil Corp. (IPOOF)
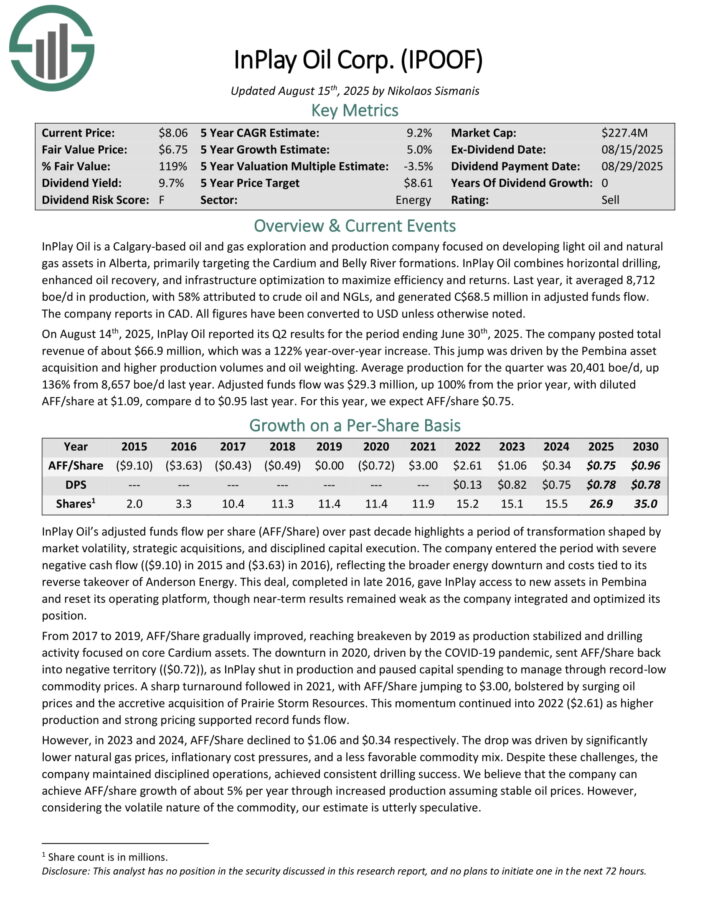
InPlay Oil is a Calgary-based oil and gas exploration and production company focused on developing light oil and natural gas assets in Alberta, primarily targeting the Cardium and Belly River formations. InPlay Oil combines horizontal drilling, enhanced oil recovery, and infrastructure optimization to maximize efficiency and returns.
Last year, it averaged 8,712 boe/d in production, with 58% attributed to crude oil and NGLs, and generated C$68.5 million in adjusted funds flow.
InPlay Oil is a Calgary-based oil and gas exploration and production company focused on developing light oil and natural gas assets in Alberta, primarily targeting the Cardium and Belly River formations.
InPlay Oil combines horizontal drilling, enhanced oil recovery, and infrastructure optimization to maximize efficiency and returns. Last year, it averaged 8,712 boe/d in production, with 58% attributed to crude oil and NGLs, and generated C$68.5 million in adjusted funds flow.
On August 14th, 2025, InPlay Oil reported its Q2 results for the period ending June 30th, 2025. The company posted total revenue of about $66.9 million, which was a 122% year-over-year increase. This jump was driven by the Pembina asset acquisition and higher production volumes and oil weighting.
Average production for the quarter was 20,401 boe/d, up 136% from 8,657 boe/d last year. Adjusted funds flow was $29.3 million, up 100% from the prior year, with diluted AFF/share at $1.09, compare d to $0.95 last year.
Click here to download our most recent Sure Analysis report on IPOOF (preview of page 1 of 3 shown below):
High-Yield Monthly Dividend Stock #17: Firm Capital Property Trust (FRMUF)
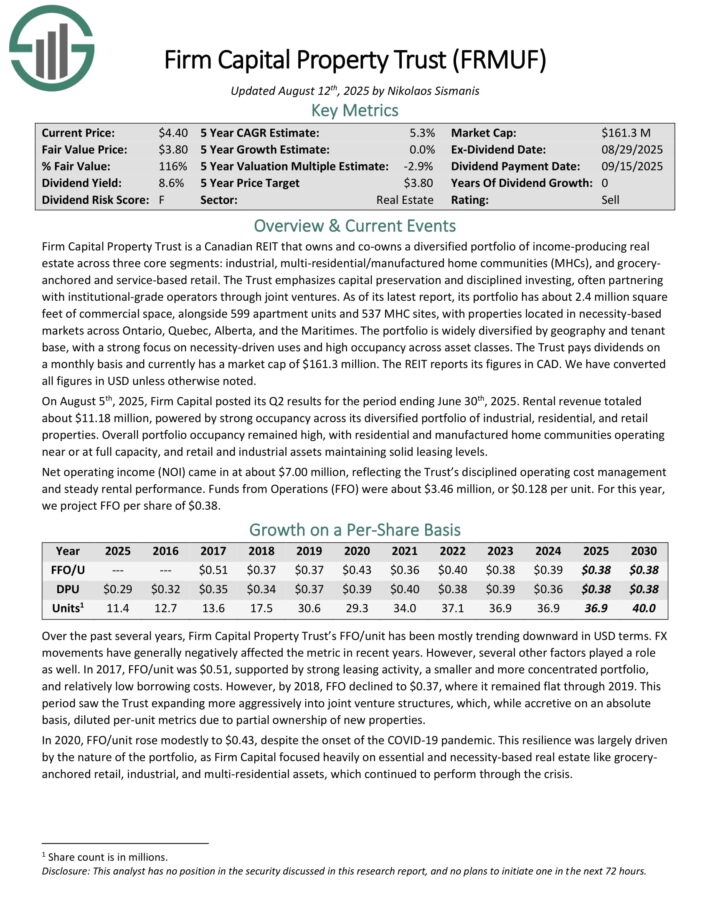
Firm Capital Property Trust is a Canadian REIT that owns and co-owns a diversified portfolio of income-producing real estate across three core segments: industrial, multi-residential/manufactured home communities (MHCs), and grocery anchored and service-based retail.
The Trust emphasizes capital preservation and disciplined investing, often partnering with institutional-grade operators through joint ventures.
As of its latest report, its portfolio has over 2.5 million square feet of commercial space, alongside nearly 600 apartment units and 537 MHC sites, with properties located in necessity based markets across Ontario, Quebec, Alberta, and the Maritimes.
On August 5th, 2025, Firm Capital posted its Q2 results for the period ending June 30th, 2025. Rental revenue totaled about $11.18 million, powered by strong occupancy across its diversified portfolio of industrial, residential, and retail properties.
Overall portfolio occupancy remained high, with residential and manufactured home communities operating near or at full capacity, and retail and industrial assets maintaining solid leasing levels.
Net operating income (NOI) came in at about $7.00 million, reflecting the Trust’s disciplined operating cost management and steady rental performance.
Funds from Operations (FFO) were about $3.46 million, or $0.128 per unit. For this year, we project FFO per share of $0.38.
Click here to download our most recent Sure Analysis report on FRMUF (preview of page 1 of 3 shown below):
High-Yield Monthly Dividend Stock #16: Cardinal Energy Ltd. (CRLFF)
Cardinal Energy is a Canadian oil and gas producer operating primarily in Alberta and Saskatchewan, with a strong focus on conventional light and medium oil.
Its operations are centered on mature, low-decline fields where enhanced oil recovery methods, like waterflooding and CO₂ injection, are actively used to maintain stable production.
The company manages a large inventory of vertical and horizontal wells tied into company-owned infrastructure, which supports efficient field operations and cost control.
With over 90% of production weighted to oil and NGLs, Cardinal’s day-to-day operations are heavily oil-driven, with ongoing maintenance, recompletions, and targeted infill drilling forming the backbone of its development activity.
On July 30th, 2025, Cardinal Energy reported its Q2 results for the period ending June 30th, 2025. Total revenue for the quarter was about $94.0 million, down 25% from the same period in 2024, primarily due to lower commodity prices.
Production averaged 21,184 boe/d, down 5% year-over-year, with oil and NGLs continuing to make up over 90% of the mix.
Operating income came in at $36.07 million, reflecting weaker pricing but partially offset by lower operating expenses. Diluted EPS was $0.073, down from $0.183 in the prior year.
Click here to download our most recent Sure Analysis report on CRLFF (preview of page 1 of 3 shown below):

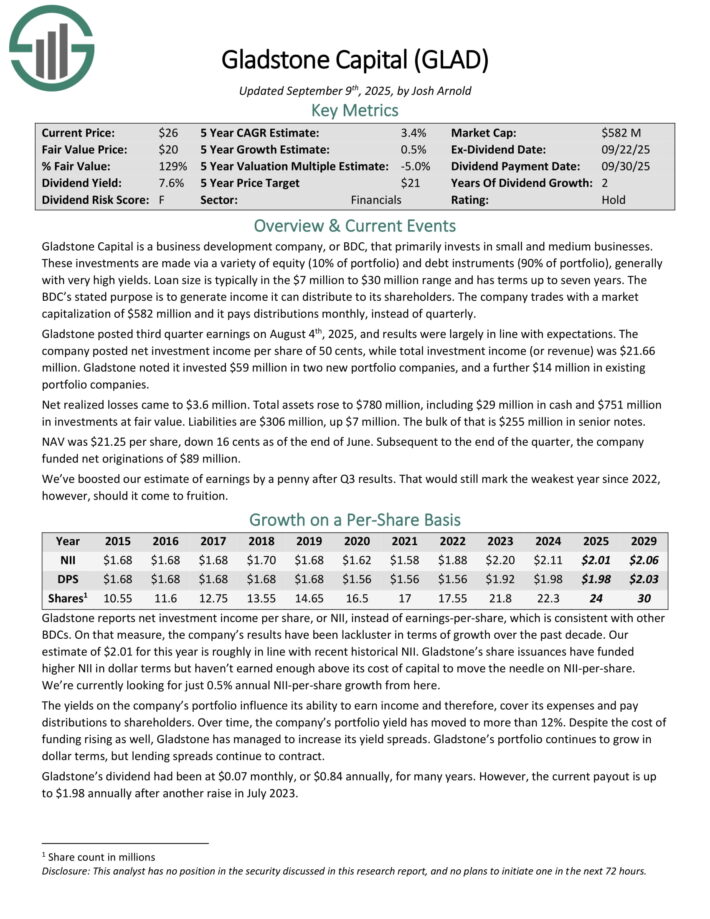
High-Yield Monthly Dividend Stock #15: Gladstone Capital Corp. (GLAD)
Gladstone Capital is a business development company, or BDC, that primarily invests in small and medium businesses. These investments are made via a variety of equity (10% of portfolio) and debt instruments (90% of portfolio), generally with very high yields.
Loan size is typically in the $7 million to $30 million range and has terms up to seven years. The BDC’s stated purpose is to generate income it can distribute to its shareholders.
Gladstone posted third quarter earnings on August 4th, 2025, and results were largely in line with expectations. The company posted net investment income per share of 50 cents, while total investment income (or revenue) was $21.66 million.
Gladstone noted it invested $59 million in two new portfolio companies, and a further $14 million in existing portfolio companies.
Net realized losses came to $3.6 million. Total assets rose to $780 million, including $29 million in cash and $751 million in investments at fair value. Liabilities are $306 million, up $7 million. The bulk of that is $255 million in senior notes.
NAV was $21.25 per share, down 16 cents as of the end of June. Subsequent to the end of the quarter, the company funded net originations of $89 million.
Click here to download our most recent Sure Analysis report on GLAD (preview of page 1 of 3 shown below):
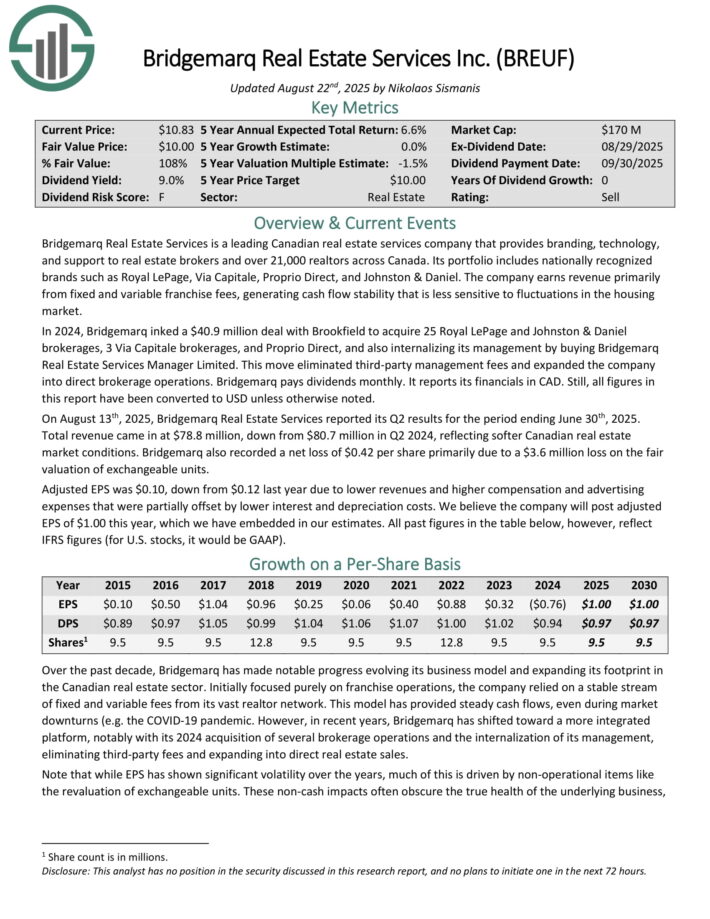
High-Yield Monthly Dividend Stock #14: Bridgemarq Real Estate (BREUF)
Bridgemarq Real Estate Services is a leading Canadian real estate services company that provides branding, technology, and support to real estate brokers and over 21,000 realtors across Canada. Its portfolio includes nationally recognized brands such as Royal LePage, Via Capitale, Proprio Direct, and Johnston & Daniel.
The company earns revenue primarily from fixed and variable franchise fees, generating cash flow stability that is less sensitive to fluctuations in the housing market.
On August 13th, 2025, Bridgemarq Real Estate Services reported its Q2 results. Total revenue came in at $78.8 million, down from $80.7 million in Q2 2024, reflecting softer Canadian real estate market conditions.
Bridgemarq also recorded a net loss of $0.42 per share primarily due to a $3.6 million loss on the fair valuation of exchangeable units.
Adjusted EPS was $0.10, down from $0.12 last year due to lower revenues and higher compensation and advertising expenses that were partially offset by lower interest and depreciation costs.
Click here to download our most recent Sure Analysis report on BREUF (preview of page 1 of 3 shown below):
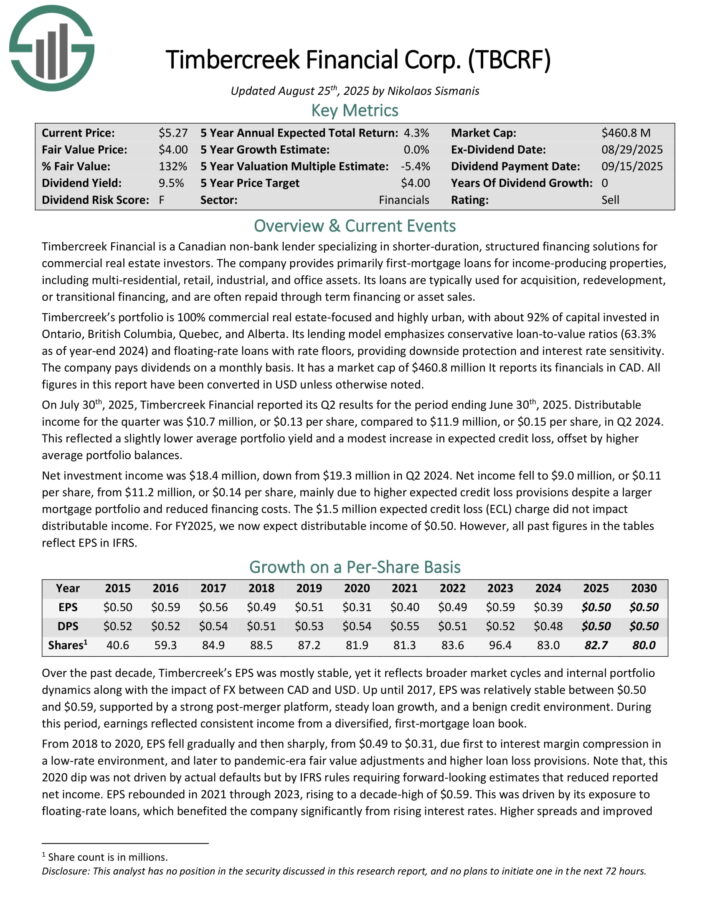
High-Yield Monthly Dividend Stock #13: Timbercreek Financial Corp. (TBCRF)
Timbercreek Financial is a Canadian non-bank lender specializing in shorter-duration, structured financing solutions for commercial real estate investors.
The company provides primarily first-mortgage loans for income-producing properties, including multi-residential, retail, industrial, and office assets. Its loans are typically used for acquisition, redevelopment, or transitional financing, and are often repaid through term financing or asset sales.
Timbercreek’s portfolio is 100% commercial real estate-focused and highly urban, with about 92% of capital invested in Ontario, British Columbia, Quebec, and Alberta.
On July 30th, 2025, Timbercreek Financial reported its Q2 results. Distributable income for the quarter was $10.7 million, or $0.13 per share, compared to $11.9 million, or $0.15 per share, in Q2 2024.
This reflected a slightly lower average portfolio yield and a modest increase in expected credit loss, offset by higher average portfolio balances.
Net investment income was $18.4 million, down from $19.3 million in Q2 2024. Net income fell to $9.0 million, or $0.11 per share, from $11.2 million, or $0.14 per share, mainly due to higher expected credit loss provisions despite a larger mortgage portfolio and reduced financing costs.
Click here to download our most recent Sure Analysis report on TBCRF (preview of page 1 of 3 shown below):
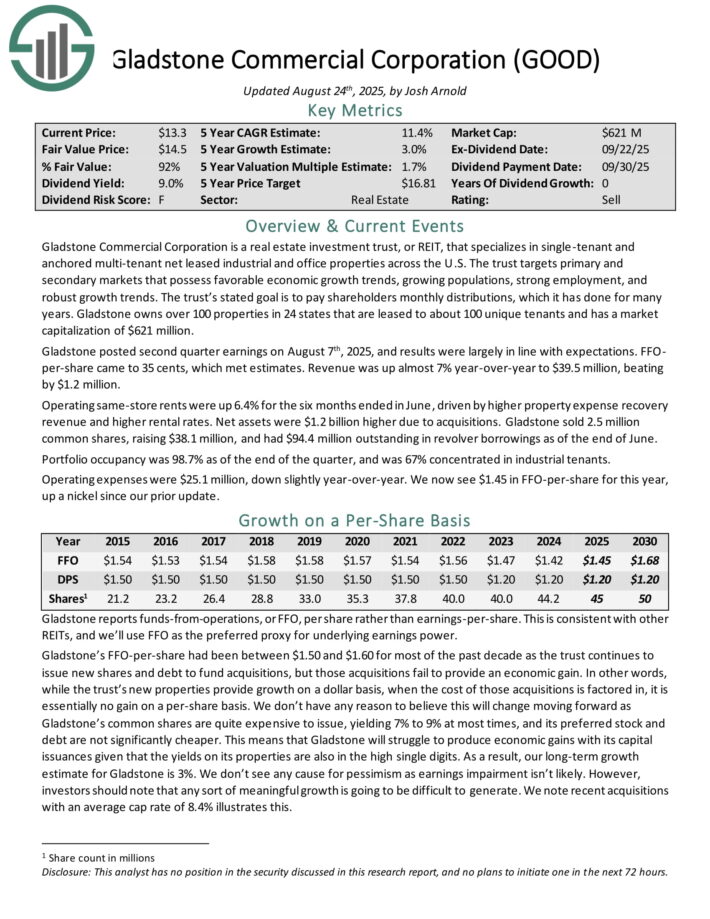
High-Yield Monthly Dividend Stock #12: Gladstone Commercial (GOOD)
Gladstone Commercial Corporation is a real estate investment trust, or REIT, that specializes in single-tenant and anchored multi-tenant net leased industrial and office properties across the U.S.
The trust targets primary and secondary markets that possess favorable economic growth trends, growing populations, strong employment, and robust growth trends.
The trust’s stated goal is to pay shareholders monthly distributions, which it has done for more than 17 consecutive years. Gladstone owns over 100 properties in 24 states that are leased to about 100 unique tenants.
Gladstone posted second quarter earnings on August 7th, 2025, and results were largely in line with expectations. FFO-per-share came to 35 cents, which met estimates. Revenue was up almost 7% year-over-year to $39.5 million, beating by $1.2 million.
Operating same-store rents were up 6.4% for the six months ended in June, driven by higher property expense recovery revenue and higher rental rates. Net assets were $1.2 billion higher due to acquisitions.
Gladstone sold 2.5 million common shares, raising $38.1 million, and had $94.4 million outstanding in revolver borrowings as of the end of June. Portfolio occupancy was 98.7% as of the end of the quarter, and was 67% concentrated in industrial tenants.
Click here to download our most recent Sure Analysis report on GOOD (preview of page 1 of 3 shown below):
High-Yield Monthly Dividend Stock #11: Ellington Financial (EFC)
Ellington Financial Inc. acquires and manages mortgage, consumer, corporate, and other related financial assets in the United States.
The company acquires and manages residential mortgage–backed securities (RMBS) backed by prime jumbo, Alt–A, manufactured housing, and subprime residential mortgage loans.
Additionally, it manages RMBS, for which the U.S. government guarantees the principal and interest payments. It also provides collateralized loan obligations, mortgage–related and non–mortgage–related derivatives, equity investments in mortgage originators and other strategic investments.
On August 7th, 2025, Ellington Financial reported its Q2 results for the period ending June 30th, 2025. As with previous quarters, the company reported only income, not revenues. Gross interest income totaled $115.47 million, essentially flat sequentially, while net interest margins improved in the credit strategy and Longbridge delivered strong origination and servicing contributions.
Adjusted EPS (or “Adjusted Distributable EPS”) came in at $0.47, an eight-cent boost year-over-year. The improvement reflected robust securitization activity, positive carry on swap hedges, and a strong $0.13 contribution from Longbridge, though the Agency strategy posted a modest $(0.01) per share loss amid wider spreads and hedge-driven losses.
Book value per share rose to $13.49 at the end of Q2 from $13.44 in Q1, after accounting for the $0.39 in dividends paid during the quarter.
Click here to download our most recent Sure Analysis report on Ellington Financial (EFC) (preview of page 1 of 3 shown below):

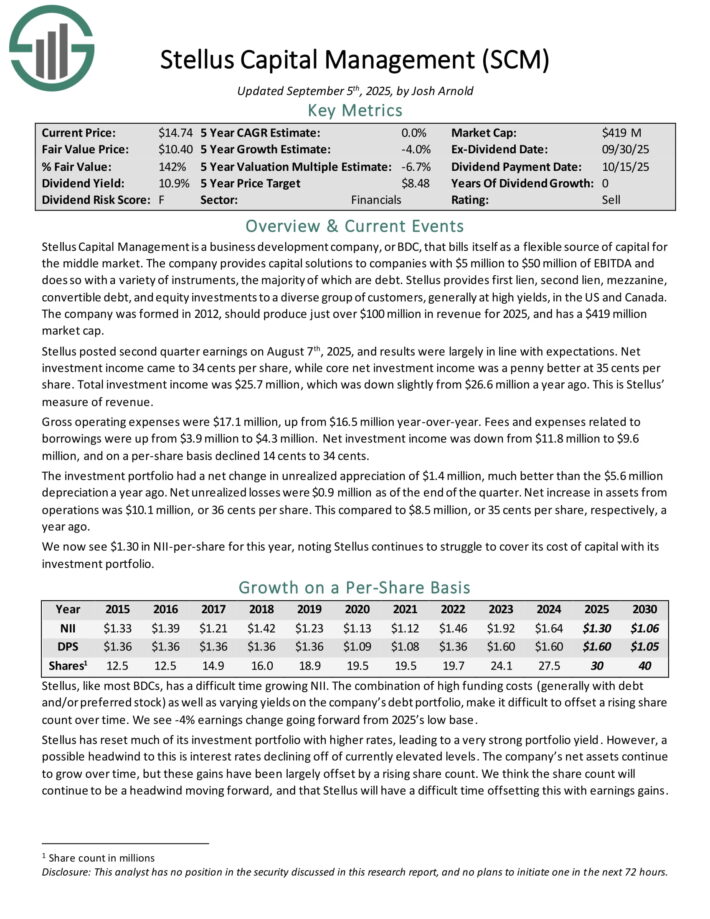
High-Yield Monthly Dividend Stock #10: Stellus Capital (SCM)
Stellus Capital Management provides capital solutions to companies with $5 million to $50 million of EBITDA and does so with a variety of instruments, the majority of which are debt.
Stellus provides first lien, second lien, mezzanine, convertible debt, and equity investments to a diverse group of customers, generally at high yields, in the US and Canada.
Stellus posted second quarter earnings on August 7th, 2025, and results were largely in line with expectations. Net investment income came to 34 cents per share, while core net investment income was a penny better at 35 cents per share.
Total investment income was $25.7 million, which was down slightly from $26.6 million a year ago. This is Stellus’ measure of revenue.
Gross operating expenses were $17.1 million, up from $16.5 million year-over-year. Fees and expenses related to borrowings were up from $3.9 million to $4.3 million. Net investment income was down from $11.8 million to $9.6 million, and on a per-share basis declined 14 cents to 34 cents.
The investment portfolio had a net change in unrealized appreciation of $1.4 million, much better than the $5.6 million depreciation a year ago.
Click here to download our most recent Sure Analysis report on SCM (preview of page 1 of 3 shown below):
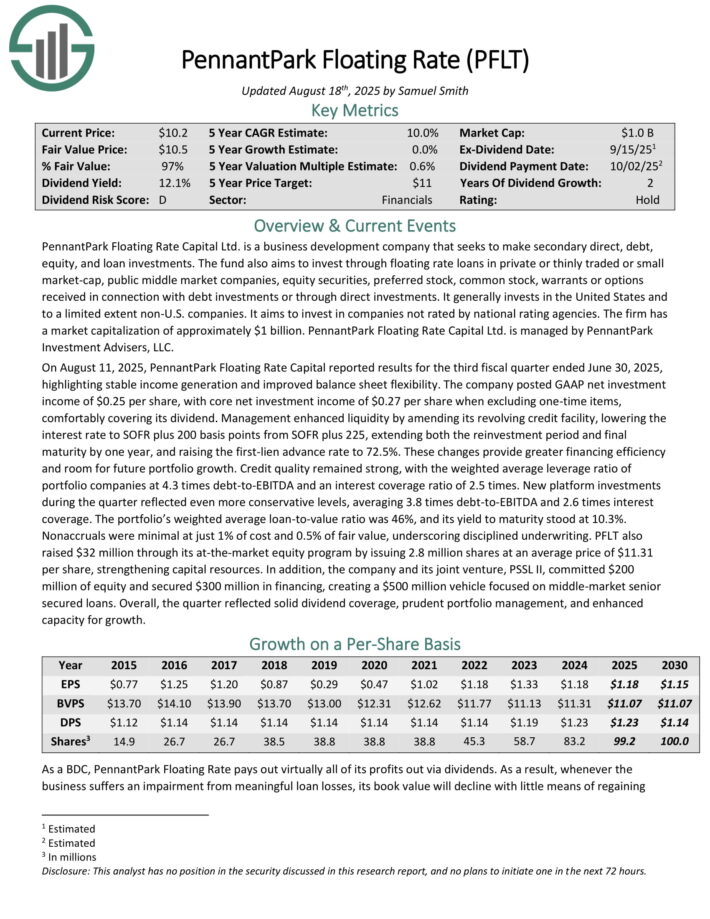
High-Yield Monthly Dividend Stock #9: PennantPark Floating Rate Capital (PFLT)
PennantPark Floating Rate Capital Ltd. is a business development company that seeks to make secondary direct, debt, equity, and loan investments.
The fund also aims to invest through floating rate loans in private or thinly traded or small market-cap, public middle market companies, equity securities, preferred stock, common stock, warrants or options received in connection with debt investments or through direct investments.
On August 11, 2025, PennantPark Floating Rate Capital reported results for the third fiscal quarter ended June 30, 2025, highlighting stable income generation and improved balance sheet flexibility.
The company posted GAAP net investment income of $0.25 per share, with core net investment income of $0.27 per share when excluding one-time items, comfortably covering its dividend.
Management enhanced liquidity by amending its revolving credit facility, lowering the interest rate to SOFR plus 200 basis points from SOFR plus 225, extending both the reinvestment period and final maturity by one year, and raising the first-lien advance rate to 72.5%.
These changes provide greater financing efficiency and room for future portfolio growth. Credit quality remained strong, with the weighted average leverage ratio of portfolio companies at 4.3 times debt-to-EBITDA and an interest coverage ratio of 2.5 times.
New platform investments during the quarter reflected even more conservative levels, averaging 3.8 times debt-to-EBITDA and 2.6 times interest coverage. The portfolio’s weighted average loan-to-value ratio was 46%, and its yield to maturity stood at 10.3%.
Nonaccruals were minimal at just 1% of cost and 0.5% of fair value, underscoring disciplined underwriting. PFLT also raised $32 million through its at-the-market equity program by issuing 2.8 million shares at an average price of $11.31 per share, strengthening capital resources.
In addition, the company and its joint venture, PSSL II, committed $200 million of equity and secured $300 million in financing, creating a $500 million vehicle focused on middle-market senior secured loans.
Click here to download our most recent Sure Analysis report on PFLT (preview of page 1 of 3 shown below):
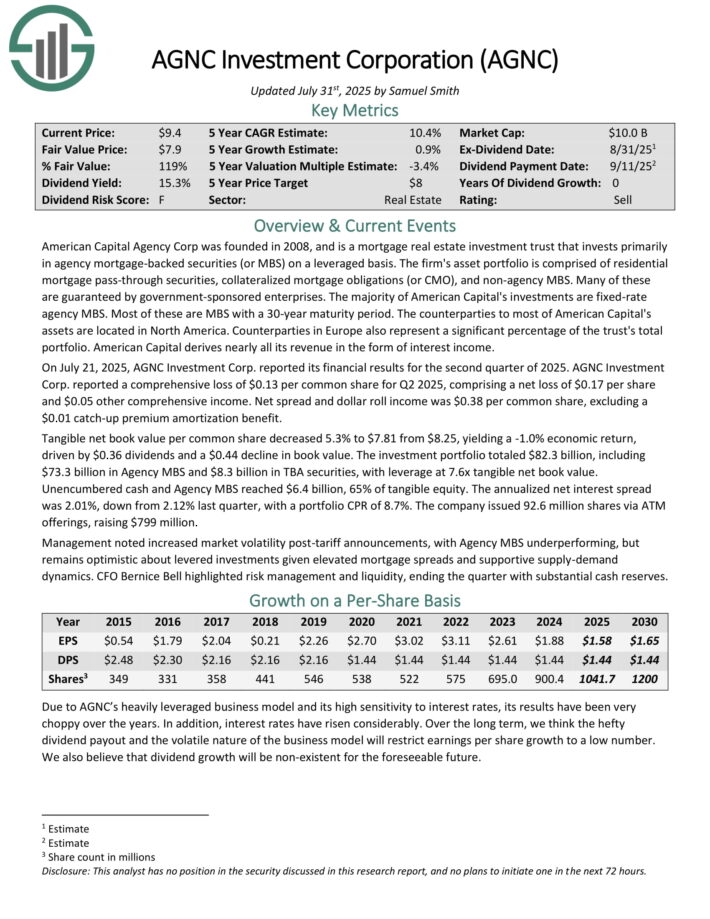
High-Yield Monthly Dividend Stock #8: AGNC Investment Corporation (AGNC)
American Capital Agency Corp is a mortgage real estate investment trust that invests primarily in agency mortgage–backed securities (or MBS) on a leveraged basis.
The firm’s asset portfolio is comprised of residential mortgage pass–through securities, collateralized mortgage obligations (or CMO), and non–agency MBS. Many of these are guaranteed by government–sponsored enterprises.
On July 21, 2025, AGNC Investment Corp. reported its financial results for the second quarter of 2025. AGNC Investment Corp. reported a comprehensive loss of $0.13 per common share for Q2 2025, comprising a net loss of $0.17 per share and $0.05 other comprehensive income.
Net spread and dollar roll income was $0.38 per common share, excluding a $0.01 catch-up premium amortization benefit.
Tangible net book value per common share decreased 5.3% to $7.81 from $8.25, yielding a -1.0% economic return, driven by $0.36 dividends and a $0.44 decline in book value. The investment portfolio totaled $82.3 billion, including $73.3 billion in Agency MBS and $8.3 billion in TBA securities, with leverage at 7.6x tangible net book value.
Unencumbered cash and Agency MBS reached $6.4 billion, 65% of tangible equity. The annualized net interest spread was 2.01%, down from 2.12% last quarter, with a portfolio CPR of 8.7%. The company issued 92.6 million shares via ATM offerings, raising $799 million.
Click here to download our most recent Sure Analysis report on AGNC Investment Corp (AGNC) (preview of page 1 of 3 shown below):
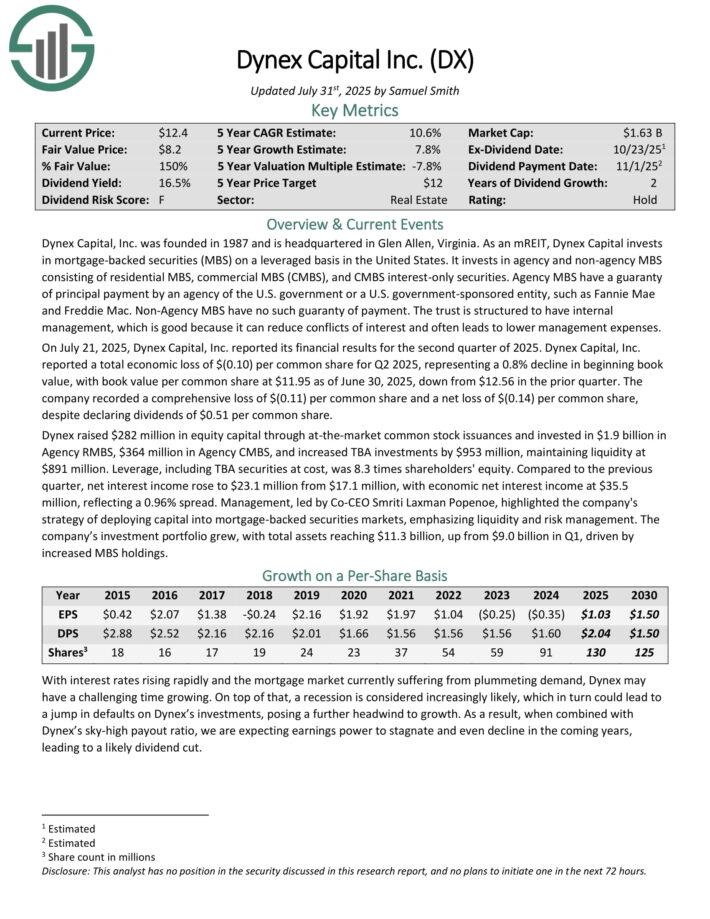
High-Yield Monthly Dividend Stock #7: Dynex Capital (DX)
Dynex Capital invests in mortgage–backed securities (MBS) on a leveraged basis in the United States. It invests in agency and non–agency MBS consisting of residential MBS, commercial MBS (CMBS), and CMBS interest–only securities.
On July 21, 2025, Dynex Capital, Inc. reported its financial results for the second quarter of 2025. Dynex reported a total economic loss of $(0.10) per common share for Q2 2025, representing a 0.8% decline in beginning book value.
The company recorded a comprehensive loss of $(0.11) per common share and a net loss of $(0.14) per common share, despite declaring dividends of $0.51 per common share.
Dynex raised $282 million in equity capital through at-the-market common stock issuances and invested in $1.9 billion in Agency RMBS, $364 million in Agency CMBS, and increased TBA investments by $953 million, maintaining liquidity at $891 million. Leverage, including TBA securities at cost, was 8.3 times shareholders’ equity.
Click here to download our most recent Sure Analysis report on DX (preview of page 1 of 3 shown below):
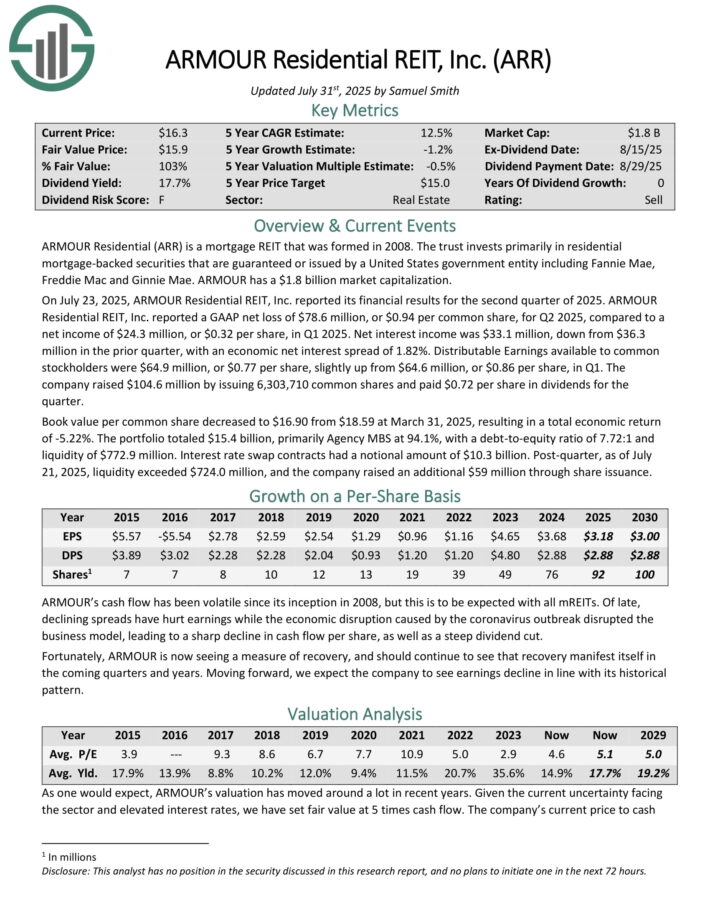
High-Yield Monthly Dividend Stock #6: ARMOUR Residential REIT (ARR)
ARMOUR Residential invests in residential mortgage-backed securities that include U.S. Government-sponsored entities (GSE) such as Fannie Mae and Freddie Mac.
It also includes Ginnie Mae, the Government National Mortgage Administration’s issued or guaranteed securities backed by fixed-rate, hybrid adjustable-rate, and adjustable-rate home loans.
Unsecured notes and bonds issued by the GSE and the US Treasury, money market instruments, and non-GSE or government agency-backed securities are examples of other types of investments.
On July 23, 2025, ARMOUR Residential REIT, Inc. reported its financial results for the second quarter of 2025. ARMOUR Residential REIT, Inc. reported a GAAP net loss of $78.6 million, or $0.94 per common share, for Q2 2025, compared to a net income of $24.3 million, or $0.32 per share, in Q1 2025.
Net interest income was $33.1 million, down from $36.3 million in the prior quarter, with an economic net interest spread of 1.82%. Distributable Earnings available to common stockholders were $64.9 million, or $0.77 per share, slightly up from $64.6 million, or $0.86 per share, in Q1.
The company raised $104.6 million by issuing 6,303,710 common shares and paid $0.72 per share in dividends for the quarter. Book value per common share decreased to $16.90 from $18.59 at March 31, 2025, resulting in a total economic return of -5.22%.
The portfolio totaled $15.4 billion, primarily Agency MBS at 94.1%, with a debt-to-equity ratio of 7.72:1 and liquidity of $772.9 million.
Click here to download our most recent Sure Analysis report on ARMOUR Residential REIT Inc (ARR) (preview of page 1 of 3 shown below):
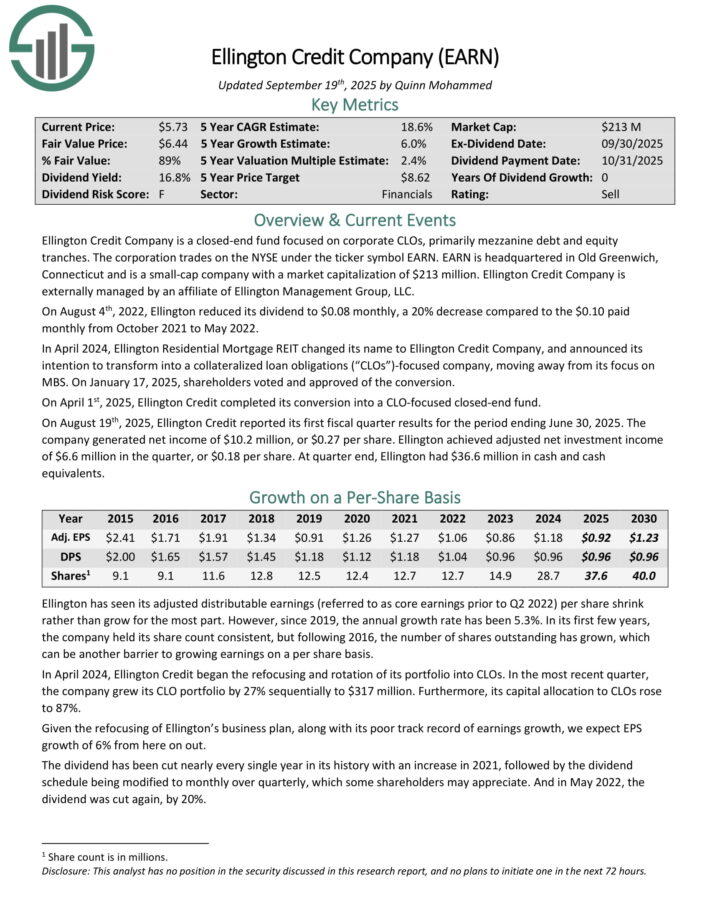
High-Yield Monthly Dividend Stock #5: Ellington Credit Co. (EARN)
Ellington Credit Co. acquires, invests in, and manages residential mortgage and real estate related assets. Ellington focuses primarily on residential mortgage-backed securities, specifically those backed by a U.S. Government agency or U.S. government–sponsored enterprise.
Agency MBS are created and backed by government agencies or enterprises, while non-agency MBS are not guaranteed by the government.
On August 19th, 2025, Ellington Credit reported its first fiscal quarter results for the period ending June 30, 2025. The company generated net income of $10.2 million, or $0.27 per share.
Ellington achieved adjusted net investment income of $6.6 million in the quarter, or $0.18 per share. At quarter end, Ellington had $36.6 million in cash and cash equivalents.
Click here to download our most recent Sure Analysis report on EARN (preview of page 1 of 3 shown below):
High-Yield Monthly Dividend Stock #4: Orchid Island Capital (ORC)
Orchid Island Capital is a mortgage REIT that is externally managed by Bimini Advisors LLC and focuses on investing in residential mortgage-backed securities (RMBS), including pass-through and structured agency RMBSs.
These financial instruments generate cash flow based on residential loans such as mortgages, subprime, and home-equity loans.
On July 24, 2025, Orchid Island Capital, Inc. reported its financial results for the second quarter of 2025. The company recorded a net loss of $33.6 million, or $0.29 per common share, driven by net interest income of $23.2 million, total expenses of $5.0 million, and net realized and unrealized losses of $51.7 million on RMBS and derivatives.
Dividends declared and paid were $0.36 per common share, with book value per share at $7.21 by June 30, 2025, reflecting a total return of (4.66)%.
Liquidity remained strong at $492.5 million, comprising cash and unpledged securities, representing 54% of stockholders’ equity, with borrowing capacity exceeding $6.7 billion across 24 lenders.
Click here to download our most recent Sure Analysis report on Orchid Island Capital, Inc. (ORC) (preview of page 1 of 3 shown below):

High-Yield Monthly Dividend Stock #3: Horizon Technology (HRZN)
Horizon Technology Finance Corp. is a BDC that provides venture capital to small and medium–sized companies in the technology, life sciences, and healthcare–IT sectors.
The company has generated attractive risk–adjusted returns through directly originated senior secured loans and additional capital appreciation through warrants.
On August 7th, 2025, Horizon announced its Q2 results for the period ending June 30th, 2025. For the quarter, total investment income fell 4.5% year-over-year to $24.5 million, primarily due to lower interest income on investments from the debt investment portfolio.
More specifically, the company’s dollar-weighted annualized yield on average debt investments in Q2 of 2025 and Q2 of 2024 was 15.8% and 15.9%, respectively.
Net investment income per share (IIS) fell to $0.28, down from $0.36 compared to Q2-2024. Net asset value (NAV) per share landed at $6.75, down from $9.12 year-over-year and $8.43 sequentially.
After paying its monthly distributions, Horizon’s undistributed spillover income as of the end of the quarter was $0.94 per share, indicating a considerable cash cushion. Management assured investors of the dividend’s stability by declaring three forward monthly dividends at a rate of $0.11.
Click here to download our most recent Sure Analysis report on HRZN (preview of page 1 of 3 shown below):

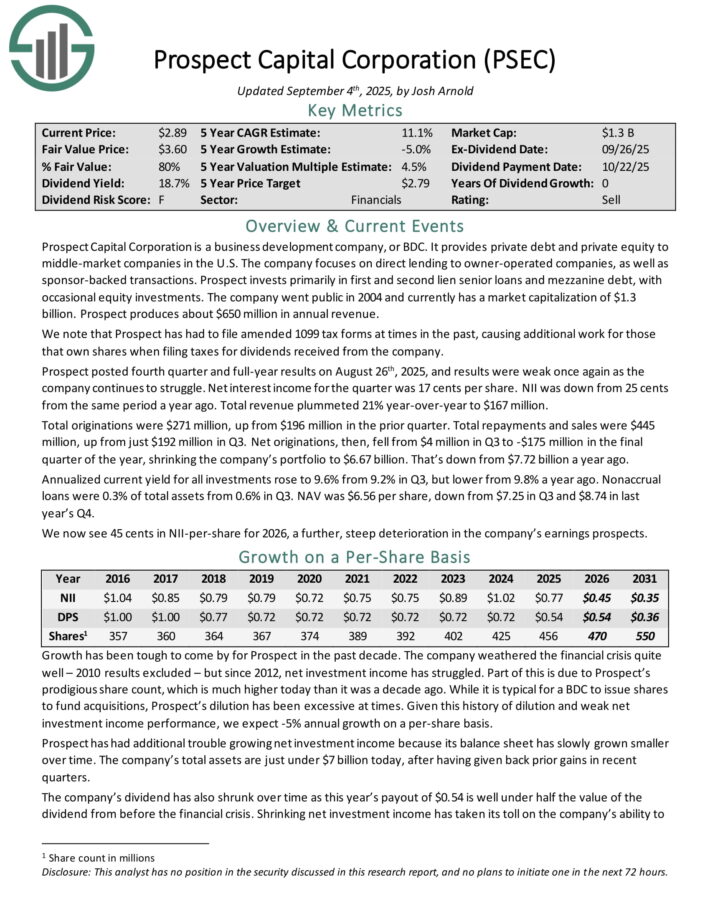
High-Yield Monthly Dividend Stock #2: Prospect Capital (PSEC)
Prospect Capital Corporation is a Business Development Company, or BDC, that provides private debt and private equity to middle–market companies in the U.S.
The company focuses on direct lending to owner–operated companies, as well as sponsor–backed transactions. Prospect invests primarily in first and second lien senior loans and mezzanine debt, with occasional equity investments.
Prospect posted fourth quarter and full-year results on August 26th, 2025, and results were weak once again as the company continues to struggle. Net interest income for the quarter was 17 cents per share. NII was down from 25 cents from the same period a year ago. Total revenue plummeted 21% year-over-year to $167 million.
Total originations were $271 million, up from $196 million in the prior quarter. Total repayments and sales were $445 million, up from just $192 million in Q3. Net originations, then, fell from $4 million in Q3 to -$175 million in the final quarter of the year, shrinking the company’s portfolio to $6.67 billion. That’s down from $7.72 billion a year ago.
Annualized current yield for all investments rose to 9.6% from 9.2% in Q3, but lower from 9.8% a year ago.
Click here to download our most recent Sure Analysis report on PSEC (preview of page 1 of 3 shown below):
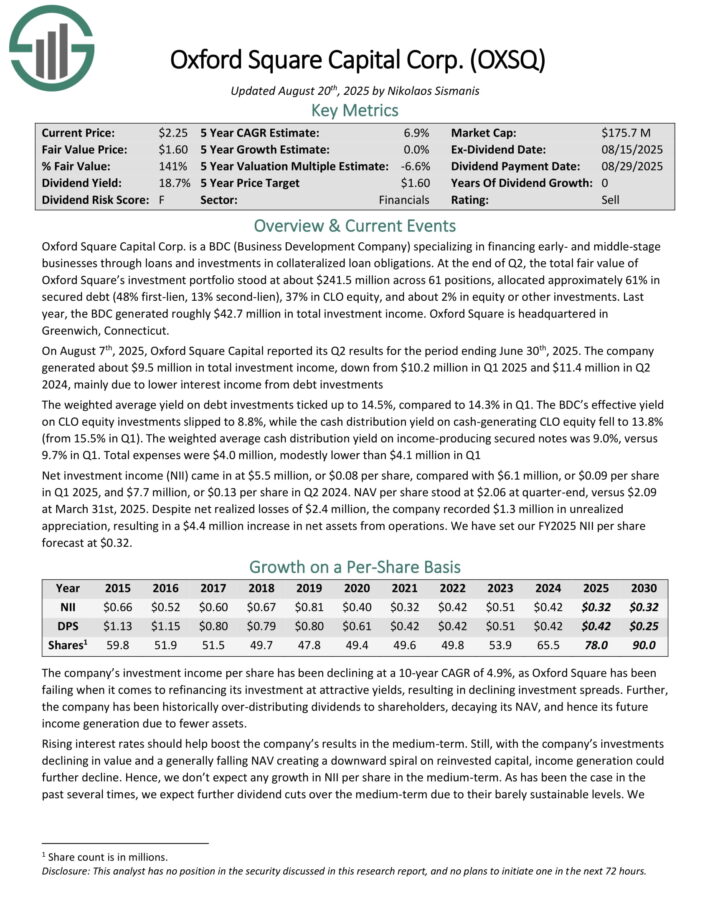
High-Yield Monthly Dividend Stock #1: Oxford Square Capital (OXSQ)
Oxford Square Capital Corp. is a BDC (Business Development Company) specializing in financing early- and middle-stage businesses through loans and investments in collateralized loan obligations.
At the end of last quarter, the total fair value of Oxford Square’s investment portfolio stood at about $243.2 million across 61 positions, allocated approximately 61% in secured debt (48% first-lien, 13% second-lien), 38% in CLO equity, and about 1% in equity or other investments. Last year, the BDC generated roughly $42.7 million in total investment income.
On August 7th, 2025, Oxford Square Capital reported its Q2 results for the period ending June 30th, 2025. The company generated about $9.5 million in total investment income, down from $10.2 million in Q1 2025 and $11.4 million in Q2 2024, mainly due to lower interest income from debt investments.
The weighted average yield on debt investments ticked up to 14.5%, compared to 14.3% in Q1. The BDC’s effective yield on CLO equity investments slipped to 8.8%, while the cash distribution yield on cash-generating CLO equity fell to 13.8% (from 15.5% in Q1).
The weighted average cash distribution yield on income-producing secured notes was 9.0%, versus 9.7% in Q1. Total expenses were $4.0 million, modestly lower than $4.1 million in Q1.
Net investment income (NII) came in at $5.5 million, or $0.08 per share, compared with $6.1 million, or $0.09 per share in Q1 2025, and $7.7 million, or $0.13 per share in Q2 2024.
Click here to download our most recent Sure Analysis report on OXSQ (preview of page 1 of 3 shown below):
Final Thoughts
Monthly dividend stocks could be more appealing to income investors than quarterly or semi-annual dividend stocks. This is because monthly dividend stocks make 12 dividend payments per year, instead of the usual 4 or 2.
Furthermore, monthly dividend stocks with high yields above 5% are even more attractive for income investors.
The 20 stocks on this list have not been vetted for dividend safety, meaning each investor should understand the unique risk factors of each company.
That said, these 20 dividend stocks make monthly payments to shareholders, and all have high dividend yields.
Further Reading
If you are interested in finding high-quality dividend growth stocks and/or other high-yield securities and income securities, the following Sure Dividend resources will be useful:
Monthly Dividend Stock Individual Security Research
Other Sure Dividend Resources
Thanks for reading this article. Please send any feedback, corrections, or questions to [email protected].
")


 Is More Entrenched Than a Cyclical Consultant")


