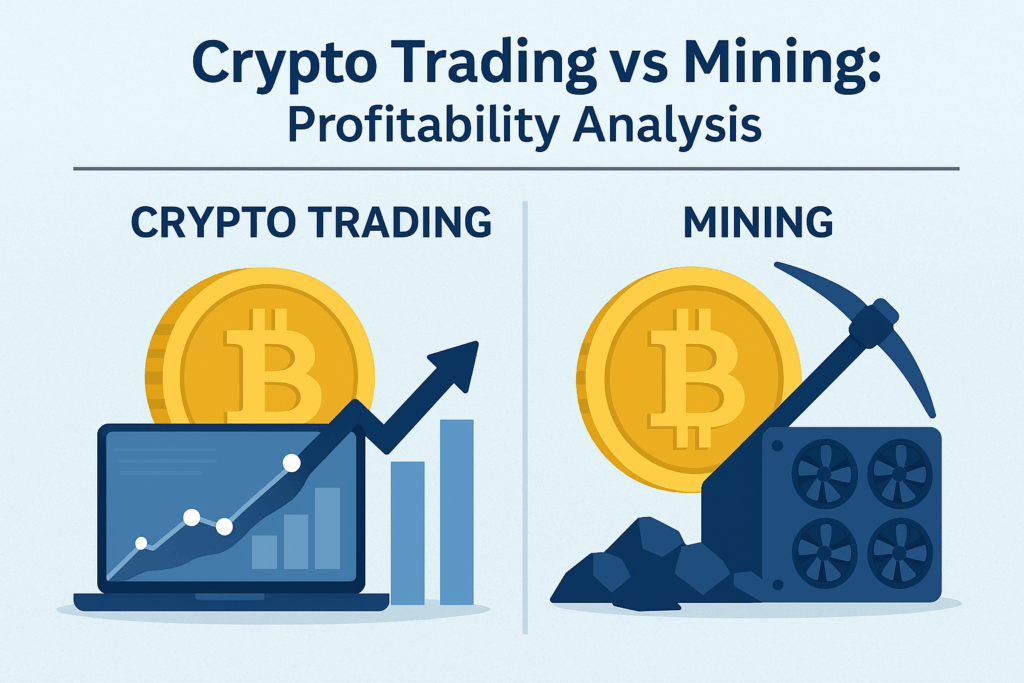
The cryptocurrency market has matured significantly since 2009, attracting millions of participants pursuing profits through two fundamentally different approaches: active trading and passive mining.
Yet a critical question remains largely unaddressed: How many people actually profit from crypto participation, and which income model delivers superior risk-adjusted returns?
This analysis examines empirical data on trader success rates, mining profitability metrics, and the fundamental structural differences between these two income strategies. The findings reveal surprising truths about active vs. passive approaches in cryptocurrency markets.
The Cryptocurrency Market: Scale and Participation
Market Size and Participant Demographics (2025)
Global cryptocurrency market:
Total market capitalization: $2.8–$3.2 trillion USD
Daily trading volume: $120–$150 billion
Active traders globally: 85–120 million individuals
Active mining operations: 200,000–500,000 businesses and hobbyists
UK-specific data:
UK crypto market participants: 8–12 million (20–28% of adult population)
Active traders: 2–3 million
Mining participants: 50,000–100,000 (primarily hobbyist/small-scale)
Average investment per participant: £2,000–£8,000
Demographic Patterns Among Participants
Active traders: Skew toward younger demographics
Age 18–35: 72% of active traders
Male/female split: 78% male / 22% female
Time commitment: 20–60+ hours weekly for active traders
Primary motivation: Short-term capital appreciation
Mining participants: More diverse demographic distribution
Age distribution: 25–55 (bimodal: young hobbyists and established businesses)
Male/female split: 85% male / 15% female
Time commitment: 5–15 hours weekly (post-setup automation)
Primary motivation: Passive income and asset accumulation
Active Cryptocurrency Trading: The Profitability Reality
How Many Traders Actually Profit?
The uncomfortable truth: most active traders lose money.
Academic research and market data:
Study conducted by Chainalysis (2023–2024) analyzing 500,000+ trader wallets:
Profitable traders: 12–18% (1 in 6–8 traders)
Break-even traders: 8–12%
Losing traders: 70–80%
Average loss for unprofitable traders: -35% to -60% annually
Why the dismal success rate?
Behavioral biases: Overconfidence, panic selling, FOMO-driven buying
Market efficiency: Retail traders compete against algorithmic systems and professional funds with information advantages
Transaction costs: Spreads, commissions, and gas fees typically cost 2–5% per trade
Volatility exploitation: Extreme price swings suit professionals; retail traders often buy peaks, sell lows
Time disadvantage: Retail traders cannot monitor markets 24/7 vs. automated trading bots
Trading Income Distribution
Among profitable traders:
Percentile
Annual Return
Number of Traders
Notes
Top 1% (professional traders)
+200% to +500%+
~10,000 globally
Rare; typically institutional
1–5% (experienced traders)
+50% to +150%
~40,000 globally
Consistent winners; rare retail
5–20% (competent traders)
+10% to +40%
~170,000 globally
Moderately profitable; most effort
20–50% (break-even/marginal)
-5% to +15%
~300,000 globally
Commission costs offset gains
Key insight: Only approximately 50,000–100,000 active traders globally achieve +50% annual returns consistently. For most participants, trading represents a wealth-transfer mechanism rather than wealth-creation tool.
Time Investment and Opportunity Cost
Active trading demands extreme time commitment:
Day traders: 40–80+ hours weekly market monitoring
Swing traders: 20–40 hours weekly analysis and execution
Opportunity cost: If £30k annual salary at average job, each trading hour costs ~£15 in foregone income
Effective hourly rate for 80% of traders: Negative (losing money while investing time)
Cryptocurrency Mining: The Passive Income Alternative
Mining Profitability: The Data
Unlike trading, mining presents fundamentally different economics.
Mining profitability metrics (2025):
Metric
Current Status
Bitcoin daily production
~900 BTC (~£36M USD)
Number of mining entities
200,000–500,000 worldwide
Average revenue per miner
£500–£5,000+ monthly (varies by location)
Success rate (profitable operations)
85–95% (vs. 12–18% for trading)
Time investment post-setup
2–5 hours weekly
Why mining success rates exceed trading by 5–7x:
Mining removes the human behavioral variables that destroy trader profitability. Instead of competing with algorithms and professionals, miners participate in a deterministic system where effort directly produces measurable output.
Mining Economics Model
Entry scenario: Small-scale mining operation (250 kW capacity)
Capital investment:
Hardware: 2–4 Antminer units
Electrical infrastructure: £5,000–£15,000
Cooling systems: £3,000–£8,000
Controls and monitoring: £2,000–£5,000
Total: £30,000–£50,000
Monthly operating costs:
Electricity (£0.08/kWh): £2,000–£3,000
Maintenance and replacement parts: £300–£500
Internet and monitoring: £50–£100
Total monthly: £2,350–£3,600
Monthly revenue (current Bitcoin price £40,000):
Daily BTC production: 0.005–0.01 BTC
Monthly: 0.15–0.30 BTC
Monthly revenue: £6,000–£12,000
Monthly profit: £2,400–£9,650 (net of electricity)
Financial metrics:
Payback period: 4–15 months (highly dependent on electricity costs)
Annual ROI: 60–150% for operations in low-cost electricity regions
Compound wealth effect: Mining operations often reinvest profits into expansion
Real-world mining profitability examples
Low-cost electricity region (£0.05/kWh – Iceland, Norway, parts of Canada):
Annual electricity cost: £11,000
Annual revenue: £72,000–£144,000
Annual profit: £61,000–£133,000
ROI: 122–266%
Average-cost electricity region (£0.10/kWh – UK, France, Germany):
Annual electricity cost: £22,000
Annual revenue: £72,000–£144,000
Annual profit: £50,000–£122,000
ROI: 100–244%
High-cost electricity region (£0.15/kWh – Japan, Australia metro areas):
Annual electricity cost: £33,000
Annual revenue: £72,000–£144,000
Annual profit: £39,000–£111,000
ROI: 78–222%
Critical insight: Mining remains profitable across an extremely wide range of electricity costs—something unique to this income model.
Mining Hardware: Technology Drives Efficiency
Modern Antminer L11 and comparable devices demonstrate how specialized hardware design directly translates to profitability:
Efficiency metrics:
Power consumption: 3–4 kW per unit
Hashrate: 500+ MH/s per unit
Lifespan: 3–5 years (if properly maintained)
Degradation: Minimal (<5% per year)
Why hardware matters:
1% efficiency improvement = 1% higher profit margin
Process node scaling (5nm vs. 14nm): 40–50% power reduction
Direct correlation between hardware investment and profitability
Comparative Analysis: Trading vs. Mining
Risk Profile Comparison
Factor
Active Trading
Mining
Profit probability
12–18%
85–95%
Capital volatility
Extreme (±50% daily)
Stable (±5–10% annually)
Time commitment
40–80+ hrs/week
2–5 hrs/week
Psychological stress
Very high
Low–moderate
Regulatory risk
Moderate (tax, rules)
Low
Technical knowledge
Essential
Helpful but learnable
Income Model Fundamentals
Active trading: Active income model
Requires constant attention and decision-making
Performance depends entirely on trader skill and psychology
Highly leveraged (small edge × high frequency = potential profits)
Potential for catastrophic losses (margin calls, liquidation)
Psychological burden: Decision fatigue, stress, regret
Mining: Passive income model
Setup requires expertise; operations are largely automated
Performance depends on hardware, electricity, and market price
Steady, predictable cash flow (daily rewards)
Losses limited to operational expenses (no liquidation risk)
Psychological benefit: “Set and forget” automation
The Investment Decision Framework
Who Should Trade?
Suitable candidates:
Professional traders with proven track records (top 1–5%)
Individuals with advanced market analysis skills
Participants with strong behavioral discipline
Those who view trading as part-time education
Only with capital they can afford to lose entirely
Reality check: If you haven’t been trading profitably for 12+ months, you likely fall into the 82–88% unprofitable cohort.
Who Should Mine?
Suitable candidates:
Anyone seeking passive income with 60–250% ROI potential
Businesses with access to cheap electricity
Organizations with technical infrastructure (cooling, electrical capacity)
Long-term investors (3–5 year horizon minimum)
Those seeking alternative asset diversification
Advantage: No prior trading experience required; outcomes scale with capital investment and electricity efficiency.
Tax and Regulatory Considerations
Trading Tax Implications (UK)
Capital Gains Tax:
Short-term gains (held <1 year): Income tax rates (20–45%)
Long-term gains (held >1 year): Capital gains tax (20%)
Trading activity classification: May trigger self-employment tax (20% National Insurance)
Annual reporting: Self-Assessment tax return required
Tax cost example:
£50,000 trading profit → £10,000–£22,500 tax liability (20–45%)
Effective net return: 40–80% of gross profit
Mining Tax Implications (UK)
Income tax on mining rewards:
Mining revenue treated as taxable income (self-employment)
Income tax: 20% (basic rate) to 45% (higher rate)
National Insurance: 9% on profits >£12,570
Capital allowances: Equipment depreciated over 3–5 years (reduces taxable income)
Tax efficiency example:
£100,000 mining revenue
£40,000 electricity costs (deductible)
£60,000 taxable income
Tax liability: £10,800–£27,000 (18–45% effective rate)
Net profit: £33,000–£49,200
Key advantage: Mining’s deductible operating costs create superior tax efficiency vs. trading.
Real-World Case Studies
Case Study 1: Active Day Trader (Unprofitable Outcome)
Profile: 28-year-old investment banker, £50,000 initial capital
Results (Year 1):
Trading activity: 400+ trades annually
Time invested: 60 hours weekly
Commissions paid: £3,200 (account fees + spreads)
Capital result: -£8,000 (-16% loss)
Effective hourly rate: -£2.50/hour
Opportunity cost: -£48,000 (foregone employment income)
Total economic loss: £56,000
Case Study 2: Passive Miner (Profitable Outcome)
Profile: Same 28-year-old, same £50,000 capital
Results (Year 1):
Mining hardware: 2× Antminer L11 units (£28,000)
Infrastructure: £12,000
Monthly electricity: £800
Monthly revenue: £3,000–£4,500
Annual revenue: £36,000–£54,000
Annual costs: £9,600 electricity + £2,000 maintenance
Year 1 profit: £24,400–£42,400 (49–85% ROI)
Time invested: 3–5 hours weekly
Effective hourly rate: £120–£270/hour
No opportunity cost (passive system)
Five-year projection:
Mining cumulative profit: £122,000–£212,000
Trading cumulative loss: -£40,000 to -£280,000 (based on 80% failure rate)
Conclusion: Both Can Be Profitable, But With Fundamentally Different Characteristics
The definitive answer to “which is more profitable”:
Active trading can deliver extraordinary returns (200–500%+ annually for top 1%), but requires:
Exceptional skill development (5–10 years typical)
40–80+ hours weekly active time commitment
Psychological resilience to repeated losses
Only 12–18% probability of profitability
Significant tax burden on gains
Risk of catastrophic losses
Mining delivers steady, predictable passive income (60–250% annually), requiring:
One-time technical setup and knowledge transfer
2–5 hours weekly for monitoring/maintenance
85–95% probability of profitability
Lower psychological stress (“set and forget”)
Better tax efficiency through operational deductions
Limited downside risk (losses capped at operational expenses)
The strategic distinction is critical: Trading is an active income model demanding continuous expert-level decision-making. Mining is a passive income model generating returns from automated hardware operation.
For most participants, the choice is binary: Either commit to becoming a professional trader (requiring years of training and accepting 82–88% failure probability), or deploy capital into mining infrastructure generating reliable, passive cash flow.
The data overwhelmingly suggests that passive mining, despite its lower ceiling for returns, offers superior risk-adjusted profitability for typical investors. The question is not which has higher profit potential, but which aligns with your skill set, time availability, and risk tolerance.
Choose wisely: passive returns with high probability of success, or active income with high probability of failure.


