

Updated on April 10th, 2026 by Bob Ciura
The goal of rational investors is to maximize total return under a given set of constraints.
Most investors are seeking outperformance when buying stocks. One of the most popular measures of investment outperformance is alpha.
Put simply, alpha is a financial metric that compares the performance of a given investment, with a suitable index for that investment.
We created a list of 100 high alpha stocks that have outperformed the S&P 500 Index.
You can download a spreadsheet of the 100 high alpha stocks (along with important financial metrics like price-to-earnings ratios and dividend yields) by clicking on the link below below:

This article will explain alpha in greater detail, illustrate the concept with an example, and list the top 10 high alpha stocks in the Sure Analysis Research Database right now.
Table of Contents
You can use the links below to instantly jump to an individual section of the article:
What Is Alpha?
As previously mentioned, Alpha compares the performance of a given investment, with a suitable index for that investment.
In most cases, the index utilized for comparison is the S&P 500 Index, arguably the most well-known stock market index in the world.
If a stock has an alpha value of 1.0, it means the security in question outperformed the chosen index by 1% over whatever time frame is used for comparison.
By contrast, a negative alpha means the stock underperformed the index.
For example, an alpha of -1 means the stock underperformed the index by 1% per year over the specified time period.
Alpha is one of several performance measures that are commonly used to evaluate an investment security or portfolio. Another common performance measure is Beta, which measures a stock’s volatility compared with an index.
Related: Low Beta Stocks List
Alpha and beta are both used to calculate the capital asset pricing model, otherwise known as CAPM, which calculates the required return of an investment to compensate for the level of risk involved.
Expected returns are also important for valuation analysis. The formula for expected total return of a stock is below:
Expected total return = change in earnings-per-share x change in the price-to-earnings ratio
With this, investors can calculate alpha as follows:

The variables are defined as:
R = Portfolio return
Rf = Risk-free rate
βi = Beta of the investment
Rm = Expected return of market
Additionally, subtracting the risk free rate from the expected return of the market is also known as the market risk premium.
Our analysis uses a 4.3% risk free rate (current 10-year Treasury rate) and a 5.5% market risk premium.
To illustrate, assume a portfolio generated a total return of 20% in a given time period, with a Beta value of 1.1. In this scenario, alpha would be calculated as follows:
Alpha = (0.20-0.043) – 1.1(0.055)=.0965 or 9.65%
Therefore, the alpha in this example would be 9.65%.
The Top 10 High Alpha Stocks
The following 10 stocks have the highest alpha in the Sure Analysis Research Database. Stocks are listed by alpha value, from lowest to highest.
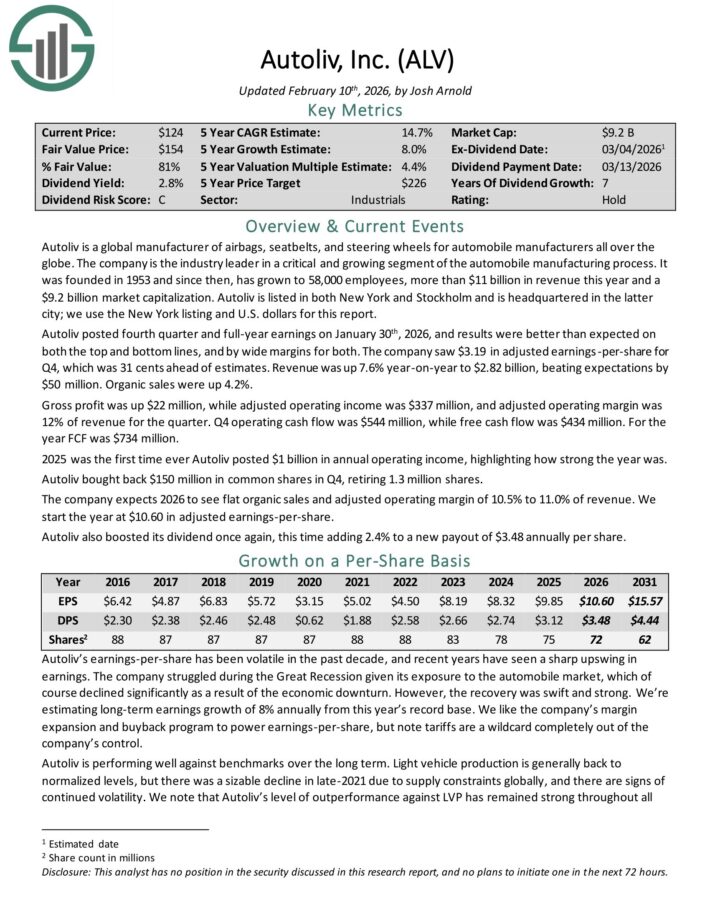
High Alpha Stock #10: Autoliv Inc. (ALV)
Autoliv is a global manufacturer of airbags, seatbelts, and steering wheels for automobile manufacturers all over the globe. The company is the industry leader in a critical and growing segment of the automobile manufacturing process.
Autoliv posted fourth quarter and full-year earnings on January 30th, 2026, and results were better than expected on both the top and bottom lines, and by wide margins for both.
The company saw $3.19 in adjusted earnings-per-share for Q4, which was 31 cents ahead of estimates.
Revenue was up 7.6% year-on-year to $2.82 billion, beating expectations by $50 million. Organic sales were up 4.2%.
Gross profit was up $22 million, while adjusted operating income was $337 million, and adjusted operating margin was 12% of revenue for the quarter. Q4 operating cash flow was $544 million, while free cash flow was $434 million.
For the year FCF was $734 million. 2025 was the first time ever Autoliv posted $1 billion in annual operating income. Autoliv bought back $150 million in common shares in Q4, retiring 1.3 million shares.
The company expects 2026 to see flat organic sales and adjusted operating margin of 10.5% to 11.0% of revenue.
Click here to download our most recent Sure Analysis report on ALV (preview of page 1 of 3 shown below):
High Alpha Stock #9: Carters Inc. (CRI)
Carter’s, Inc. is the largest branded retailer of apparel exclusively for babies and young children in North America. It was founded in 1865 by William Carter.
The company owns the Carter’s and OshKosh B’gosh brands, two of the most known brands in the children’s apparel space.
Carter’s acquired competitor OshKosh B’gosh for $312 million in 2005. Now, these brands are sold in leading department stores, national chains, and specialty retailers domestically and internationally.
Some of the growth prospects that will drive higher revenue, and earnings will be that the company continues to lead in eCommerce.
Over the next five years, the company expects eCommerce sales to grow to nearly 50% of its total U.S retail sales.
Another growth driver will come from the company’s “Age Up” initiative. This initiative focuses on apparel sales for children ages four to 10 years old. This older age apparel market is larger than the combined baby and toddler apparel markets.
Click here to download our most recent Sure Analysis report on CRI (preview of page 1 of 3 shown below):

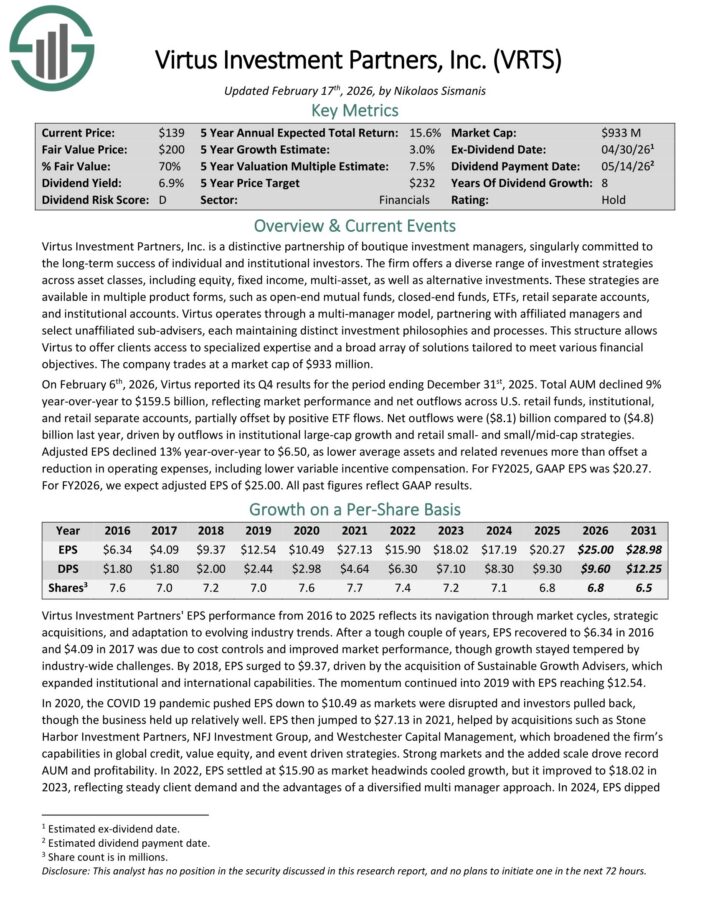
High Alpha Stock #8: Virtus Investment Partners Inc. (VRTS)
Virtus Investment Partners, Inc. is a distinctive partnership of boutique investment managers. The firm offers a diverse range of investment strategies across asset classes, including equity, fixed income, multi-asset, as well as alternative investments.
These strategies are available in multiple product forms, such as open-end mutual funds, closed-end funds, ETFs, retail separate accounts, and institutional accounts.
Virtus operates through a multi-manager model, partnering with affiliated managers and select unaffiliated sub-advisers, each maintaining distinct investment philosophies and processes.
This structure allows Virtus to offer clients access to specialized expertise and a broad array of solutions tailored to meet various financial objectives.
On February 6th, 2026, Virtus reported its Q4 results for the period ending December 31st, 2025. Total AUM declined 9% year-over-year to $159.5 billion, reflecting market performance and net outflows across U.S. retail funds, institutional, and retail separate accounts, partially offset by positive ETF flows.
Net outflows were ($8.1) billion compared to ($4.8) billion last year, driven by outflows in institutional large-cap growth and retail small- and small/mid-cap strategies.
Adjusted EPS declined 13% year-over-year to $6.50, as lower average assets and related revenues more than offset a reduction in operating expenses, including lower variable incentive compensation. For FY2025, GAAP EPS was $20.27.
Click here to download our most recent Sure Analysis report on VRTS (preview of page 1 of 3 shown below):
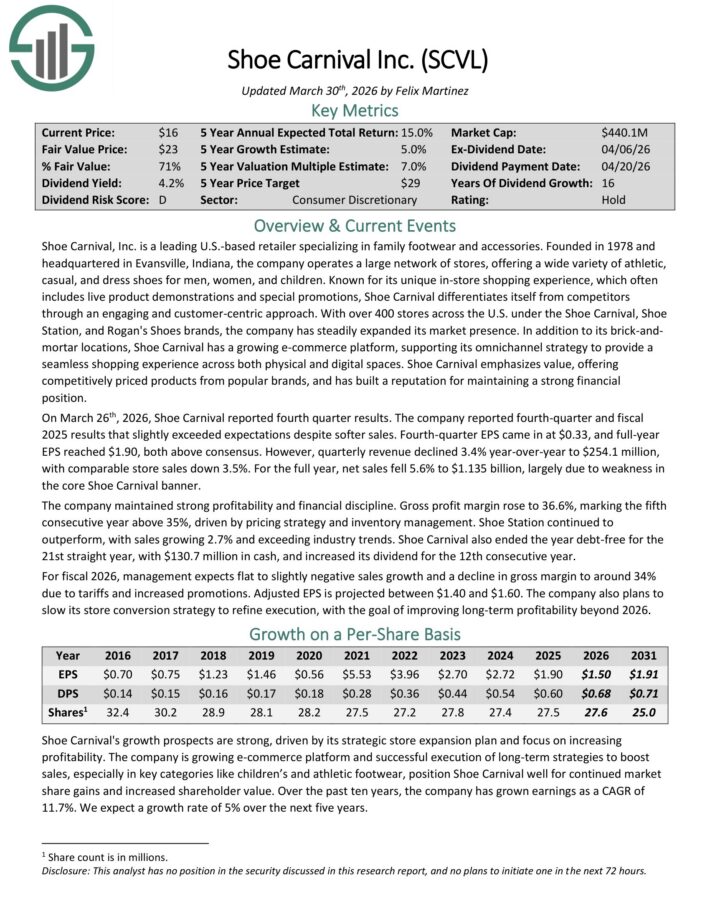
High Alpha Stock #7: Shoe Carnival Inc. (SCVL)
Shoe Carnival, Inc. is a leading U.S.-based retailer specializing in family footwear and accessories. The company operates a large network of stores, offering a wide variety of athletic, casual, and dress shoes for men, women, and children.
With over 400 stores across the U.S. under the Shoe Carnival, Shoe Station, and Rogan’s Shoes brands, the company has steadily expanded its market presence.
In addition to its brick-and mortar locations, Shoe Carnival has a growing e-commerce platform, supporting its omnichannel strategy.
On March 26th, 2026, Shoe Carnival reported fourth quarter results. The company reported fourth-quarter and fiscal 2025 results that slightly exceeded expectations despite softer sales.
Fourth-quarter EPS came in at $0.33, and full-year EPS reached $1.90, both above consensus. However, quarterly revenue declined 3.4% year-over-year to $254.1 million, with comparable store sales down 3.5%.
For the full year, net sales fell 5.6% to $1.135 billion, largely due to weakness in the core Shoe Carnival banner.
The company maintained strong profitability and financial discipline. Gross profit margin rose to 36.6%, marking the fifth consecutive year above 35%, driven by pricing strategy and inventory management.
Shoe Station continued to outperform, with sales growing 2.7% and exceeding industry trends.
Shoe Carnival also ended the year debt-free for the 21st straight year, with $130.7 million in cash, and increased its dividend for the 12th consecutive year.
Click here to download our most recent Sure Analysis report on SCVL (preview of page 1 of 3 shown below):
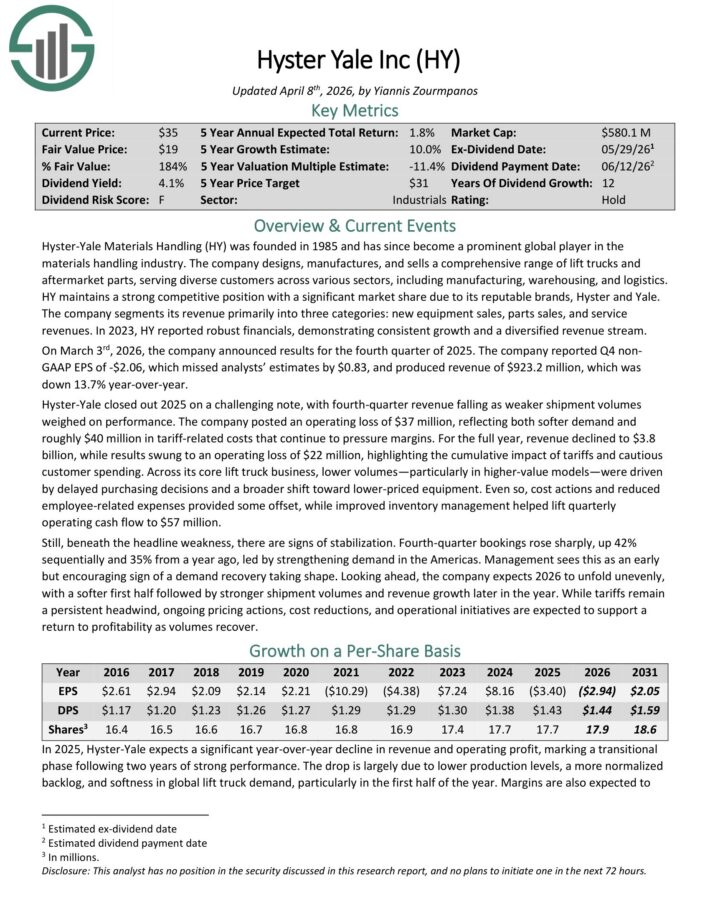
High Alpha Stock #6: Hyster Yale Inc. (HY)
Hyster-Yale Materials Handling operates in the materials handling industry. The company designs, manufactures, and sells a comprehensive range of lift trucks and aftermarket parts, serving diverse customers across various sectors, including manufacturing, warehousing, and logistics.
HY maintains a strong competitive position with a significant market share due to its reputable brands, Hyster and Yale.
The company segments its revenue primarily into three categories: new equipment sales, parts sales, and service revenues. In 2023, HY reported robust financials, demonstrating consistent growth and a diversified revenue stream.
On March 3rd, 2026, the company announced results for the fourth quarter of 2025. The company reported Q4 non GAAP EPS of -$2.06, which missed analysts’ estimates by $0.83, and produced revenue of $923.2 million, which was down 13.7% year-over-year.
Hyster-Yale closed out 2025 on a challenging note, with fourth-quarter revenue falling as weaker shipment volumes weighed on performance.
The company posted an operating loss of $37 million, reflecting both softer demand and roughly $40 million in tariff-related costs that continue to pressure margins.
For the full year, revenue declined to $3.8 billion, while results swung to an operating loss of $22 million, highlighting the cumulative impact of tariffs and cautious customer spending.
Click here to download our most recent Sure Analysis report on HY (preview of page 1 of 3 shown below):
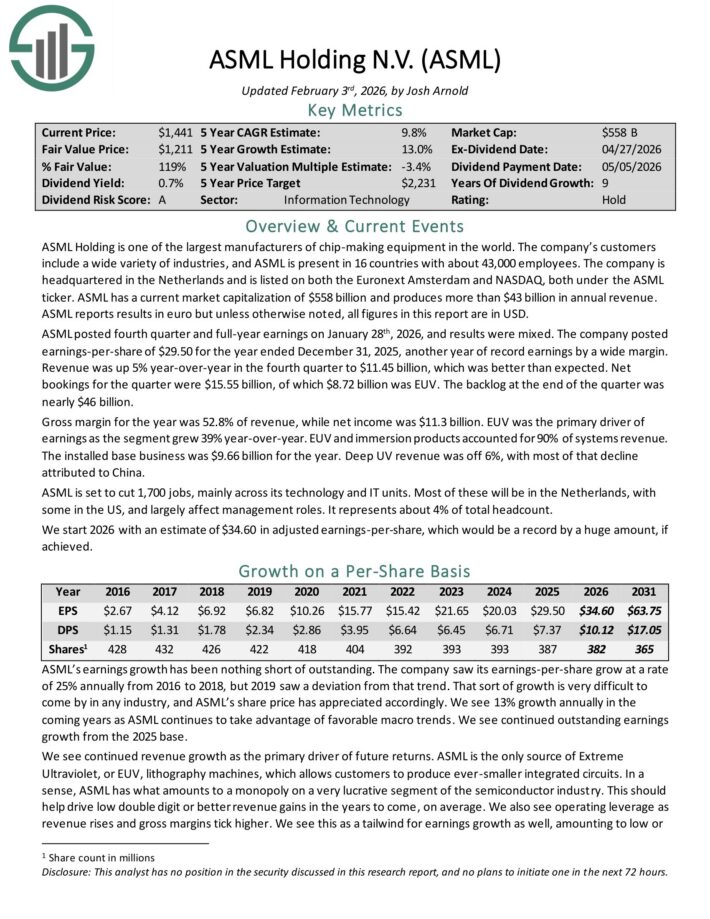
High Alpha Stock #5: ASML Holding NV (ASML)
ASML Holding is one of the largest manufacturers of chip-making equipment in the world. The company’s customers include a wide variety of industries, and ASML is present in 16 countries with about 31,000 employees.
ASML has a current market capitalization of ~$275 billion and produces more than $30 billion in annual revenue.
ASML posted fourth quarter and full-year earnings on January 28th, 2026, and results were mixed. The company posted earnings-per-share of $29.50 for the year ended December 31, 2025, another year of record earnings by a wide margin.
Revenue was up 5% year-over-year in the fourth quarter to $11.45 billion, which was better than expected. Net bookings for the quarter were $15.55 billion, of which $8.72 billion was EUV.
The backlog at the end of the quarter was nearly $46 billion.
Gross margin for the year was 52.8% of revenue, while net income was $11.3 billion. EUV was the primary driver of earnings as the segment grew 39% year-over-year. EUV and immersion products accounted for 90% of systems revenue.
The installed base business was $9.66 billion for the year. Deep UV revenue was off 6%, with most of that decline attributed to China.
Click here to download our most recent Sure Analysis report on ASML (preview of page 1 of 3 shown below):
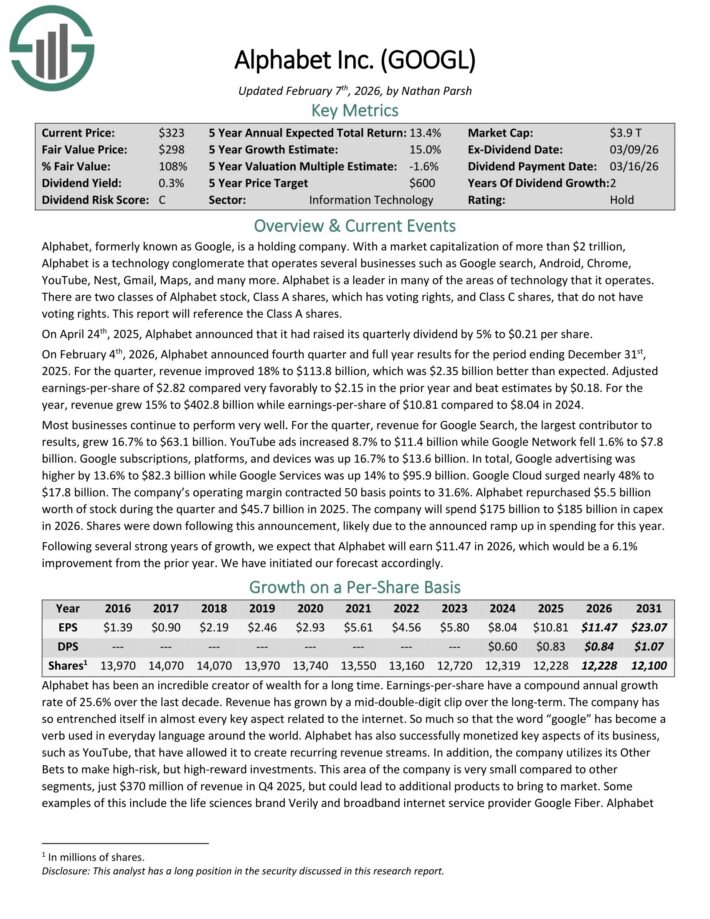
High Alpha Stock #4: Alphabet Inc. (GOOG)(GOOGL)
Alphabet is a technology conglomerate that operates several businesses such as Google search, Android, Chrome, YouTube, Nest, Gmail, Maps, and many more. Alphabet is a leader in many of the areas of technology that it operates.
There are two classes of Alphabet stock, Class A shares, which has voting rights, and Class C shares, that do not have voting rights.
On April 24th, 2025, Alphabet announced that it had raised its quarterly dividend by 5% to $0.21 per share.
On February 4th, 2026, Alphabet announced fourth quarter and full year results for the period ending December 31st, 2025. For the quarter, revenue improved 18% to $113.8 billion, which was $2.35 billion better than expected.
Adjusted earnings-per-share of $2.82 compared very favorably to $2.15 in the prior year and beat estimates by $0.18. For the year, revenue grew 15% to $402.8 billion while earnings-per-share of $10.81 compared to $8.04 in 2024.
For the quarter, revenue for Google Search, the largest contributor to results, grew 16.7% to $63.1 billion. YouTube ads increased 8.7% to $11.4 billion while Google Network fell 1.6% to $7.8 billion. Google subscriptions, platforms, and devices was up 16.7% to $13.6 billion.
In total, Google advertising was higher by 13.6% to $82.3 billion while Google Services was up 14% to $95.9 billion. Google Cloud surged nearly 48% to $17.8 billion. The company’s operating margin contracted 50 basis points to 31.6%.
Alphabet repurchased $5.5 billion worth of stock during the quarter and $45.7 billion in 2025. We expect that Alphabet will earn $11.47 in 2026, which would be a 6.1% improvement from the prior year.
Click here to download our most recent Sure Analysis report on GOOGL (preview of page 1 of 3 shown below):
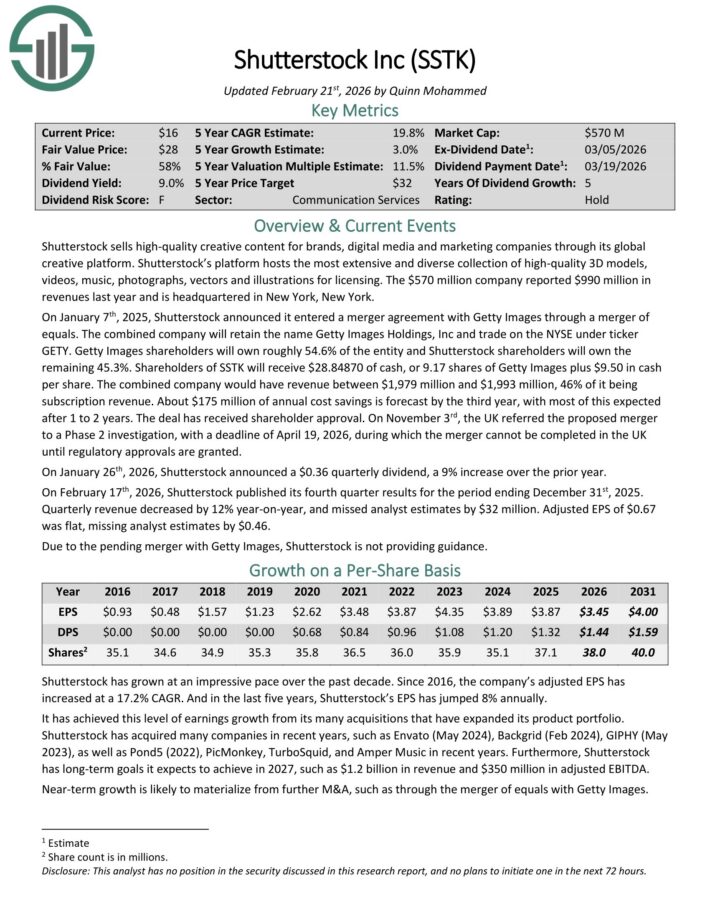
High Alpha Stock #3: Shutterstock, Inc. (SSTK)
Shutterstock sells high-quality creative content for brands, digital media and marketing companies through its global creative platform.
Its platform hosts the most extensive and diverse collection of high-quality 3D models, videos, music, photographs, vectors and illustrations for licensing. The company reported $935 million in revenues last year.
On January 7th, 2025, Shutterstock announced it entered a merger agreement with Getty Images through a merger of equals. The combined company will retain the name Getty Images Holdings, Inc and trade on the NYSE under ticker GETY.
Getty Images shareholders will own roughly 54.6% of the entity and Shutterstock shareholders will own the remaining 45.3%. Shareholders of SSTK will receive $28.84870 of cash, or 9.17 shares of Getty Images plus $9.50 in cash per share.
The combined company would have revenue between $1,979 million and $1,993 million, 46% of it being subscription revenue. About $175 million of annual cost savings is forecast by the third year, with most of this expected after 1 to 2 years.
On January 26th, 2026, Shutterstock announced a $0.36 quarterly dividend, a 9% increase over the prior year.
On February 17th, 2026, Shutterstock published its fourth quarter results for the period ending December 31st, 2025. Quarterly revenue decreased by 12% year-on-year, and missed analyst estimates by $32 million. Adjusted EPS of $0.67 was flat, missing analyst estimates by $0.46.
Click here to download our most recent Sure Analysis report on SSTK (preview of page 1 of 3 shown below):
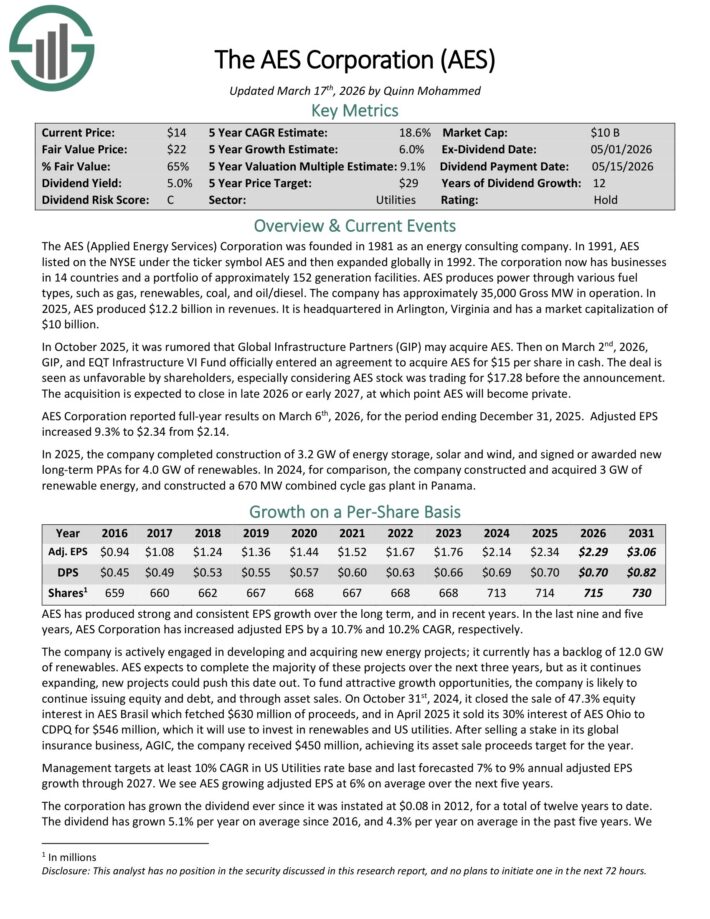
High Alpha Stock #2: AES Corp. (AES)
The AES (Applied Energy Services) Corporation was founded in 1981 as an energy consulting company. The corporation now has businesses in 14 countries and a portfolio of approximately 160 generation facilities.
AES produces power through various fuel types, such as gas, renewables, coal, and oil/diesel. The company has more than 36,000 Gross MW in operation.
On March 2nd, 2026, GIP, and EQT Infrastructure VI Fund officially entered an agreement to acquire AES for $15 per share in cash.
The deal is seen as unfavorable by shareholders, especially considering AES stock was trading for $17.28 before the announcement. The acquisition is expected to close in late 2026 or early 2027, at which point AES will become private.
AES Corporation reported full-year results on March 6th, 2026, for the period ending December 31, 2025. Adjusted EPS increased 9.3% to $2.34 from $2.14.
In 2025, the company completed construction of 3.2 GW of energy storage, solar and wind, and signed or awarded new long-term PPAs for 4.0 GW of renewables.
In 2024, for comparison, the company constructed and acquired 3 GW of renewable energy, and constructed a 670 MW combined cycle gas plant in Panama.
Click here to download our most recent Sure Analysis report on AES (preview of page 1 of 3 shown below):
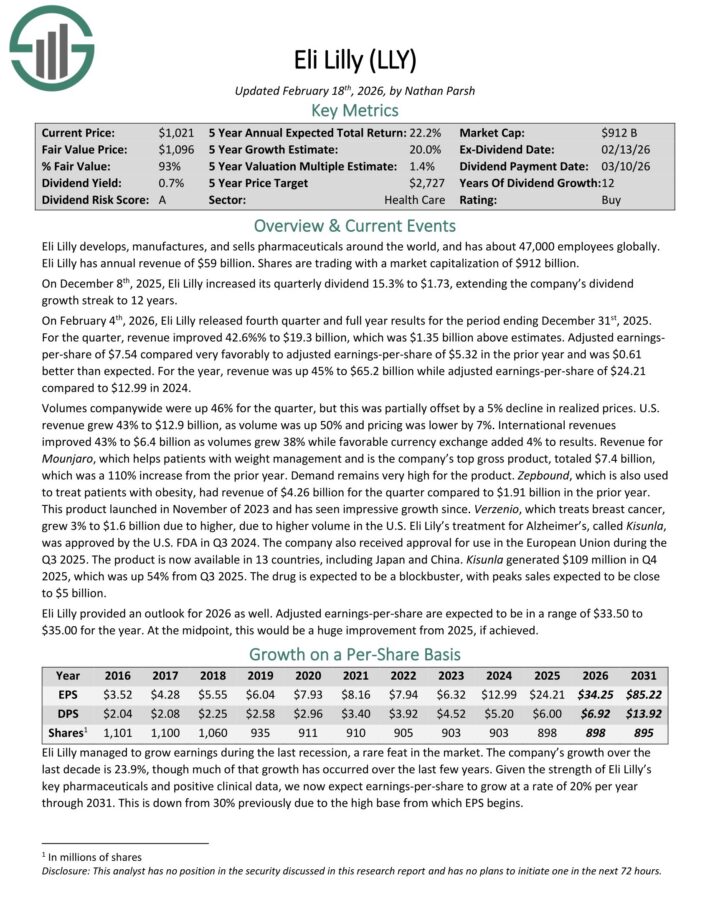
High Alpha Stock #1: Eli Lilly & Co. (LLY)
Eli Lilly develops, manufactures, and sells pharmaceuticals around the world, and has about 47,000 employees globally. Eli Lilly has annual revenue of $59 billion.
On December 8th, 2025, Eli Lilly increased its quarterly dividend 15.3% to $1.73, extending the company’s dividend growth streak to 12 years.
On February 4th, 2026, Eli Lilly released fourth quarter and full year results for the period ending December 31st, 2025.
For the quarter, revenue improved 42.6%% to $19.3 billion, which was $1.35 billion above estimates. Adjusted earnings-per-share of $7.54 compared very favorably to adjusted earnings-per-share of $5.32 in the prior year and was $0.61 better than expected.
For the year, revenue was up 45% to $65.2 billion while adjusted earnings-per-share of $24.21 compared to $12.99 in 2024.
Volumes were up 46% for the quarter, but this was partially offset by a 5% decline in realized prices. U.S. revenue grew 43% to $12.9 billion, as volume was up 50% and pricing was lower by 7%.
International revenues improved 43% to $6.4 billion as volumes grew 38% while favorable currency exchange added 4% to results..
Click here to download our most recent Sure Analysis report on LLY (preview of page 1 of 3 shown below):
Further Reading
If you are interested in finding high-quality dividend growth stocks suitable for long-term investment, the following Sure Dividend databases will be useful:
Thanks for reading this article. Please send any feedback, corrections, or questions to [email protected].


")


")


 only .99 shipped, plus more!")
