

Published on October 20th, 2025 by Bob Ciura
Long-term investors looking to build sustainable wealth over time, should consider dividend growth stocks.
High-quality dividend growth stocks tend to pay rising dividends year-after-year. This means a raise for investors every year. But the investor needs to do almost nothing to get their annual raise.
The only “work” required is to hold your dividend growth stocks so long as they continue to grow your income.
Annual dividend increases compound over time. The longer the time horizon, the greater your increased income for buying and holding.
We view the Dividend Aristocrats as among the best dividend stocks to buy-and-hold for the long run.
You can download the full Dividend Aristocrats list, along with important metrics like dividend yields and price-to-earnings ratios, by clicking on the link below:

Disclaimer: Sure Dividend is not affiliated with S&P Global in any way. S&P Global owns and maintains The Dividend Aristocrats Index. The information in this article and downloadable spreadsheet is based on Sure Dividend’s own review, summary, and analysis of the S&P 500 Dividend Aristocrats ETF (NOBL) and other sources, and is meant to help individual investors better understand this ETF and the index upon which it is based. None of the information in this article or spreadsheet is official data from S&P Global. Consult S&P Global for official information.
The securities you select for your buy and hold forever dividend growth portfolio matter.
Fortunately, eye-popping return numbers aren’t needed for long-term wealth creation. Consistently solid returns over longer periods of time can create very satisfactory results.
This article will discuss 10 of the best Dividend Aristocrats today for long-term wealth creation.
Table of Contents
The table of contents below allows for easy navigation. The stocks are listed by annual expected returns, in ascending order.
Wealth Creation Stock #10: Coca-Cola Co. (KO)
Annual Expected Returns: 9.7%
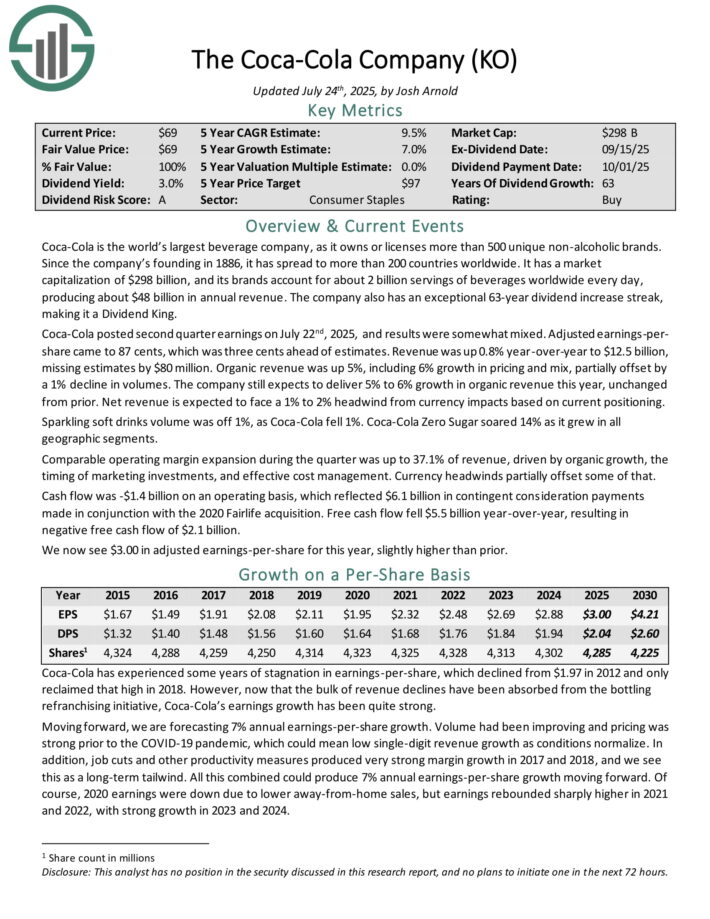
Coca-Cola is the world’s largest beverage company, as it owns or licenses more than 500 unique non–alcoholic brands. Since the company’s founding in 1886, it has spread to more than 200 countries worldwide.
Coca-Cola now has 30 billion-dollar brands in its portfolio, which each generate at least $1 billion in annual sales.
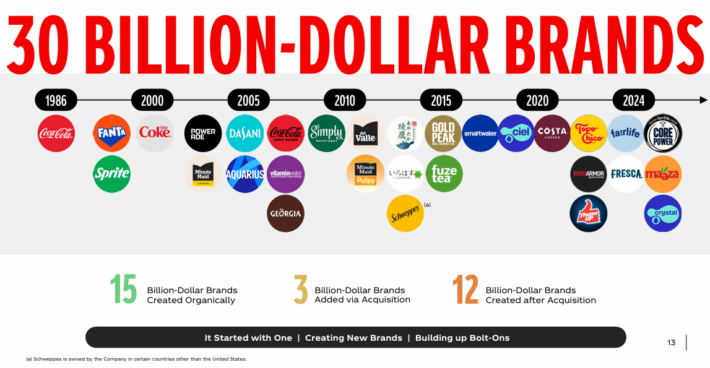
Source: Investor Presentation
Coca-Cola posted second quarter earnings on July 22nd, 2025, and results were somewhat mixed. Adjusted earnings-per-share came to 87 cents, which was three cents ahead of estimates. Revenue was up 0.8% year-over-year to $12.5 billion, missing estimates by $80 million.
Organic revenue was up 5%, including 6% growth in pricing and mix, partially offset by a 1% decline in volumes. The company still expects to deliver 5% to 6% growth in organic revenue this year, unchanged from prior. Net revenue is expected to face a 1% to 2% headwind from currency impacts based on current positioning.
Sparkling soft drinks volume was off 1%, as Coca-Cola fell 1%. Coca-Cola Zero Sugar soared 14% as it grew in all geographic segments. Comparable operating margin expansion during the quarter was up to 37.1% of revenue, driven by organic growth, the timing of marketing investments, and effective cost management. Currency headwinds partially offset some of that..
Click here to download our most recent Sure Analysis report on KO (preview of page 1 of 3 shown below):
Wealth Creation Stock #9: Illinois Tool Works (ITW)
Annual Expected Returns: 9.8%
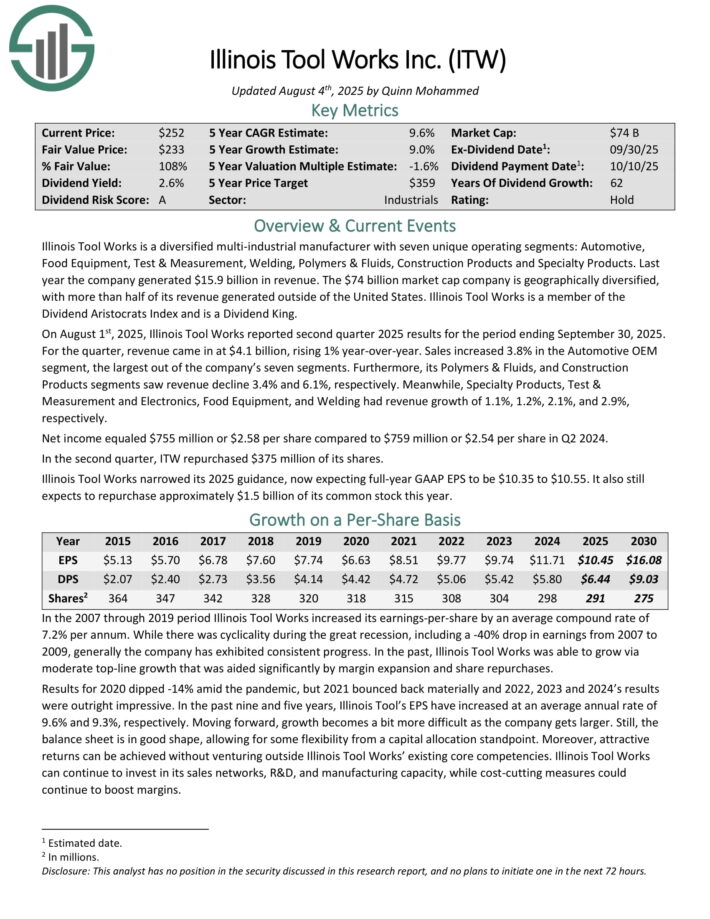
Illinois Tool Works is a diversified multi-industrial manufacturer with seven unique operating segments: Automotive, Food Equipment, Test & Measurement, Welding, Polymers & Fluids, Construction Products and Specialty Products.
Last year the company generated $15.9 billion in revenue. The company is geographically diversified, with more than half of its revenue generated outside of the United States.
On August 1st, 2025, Illinois Tool Works reported second quarter 2025 results. For the quarter, revenue came in at $4.1 billion, rising 1% year-over-year. Sales increased 3.8% in the Automotive OEM segment, the largest out of the company’s seven segments.
Furthermore, its Polymers & Fluids, and Construction Products segments saw revenue decline 3.4% and 6.1%, respectively.
Meanwhile, Specialty Products, Test & Measurement and Electronics, Food Equipment, and Welding had revenue growth of 1.1%, 1.2%, 2.1%, and 2.9%, respectively. Net income equaled $755 million or $2.58 per share compared to $759 million or $2.54 per share in Q2 2024.
Click here to download our most recent Sure Analysis report on ITW (preview of page 1 of 3 shown below):
Wealth Creation Stock #8: Brown-Forman Corp. (BF.B)
Annual Expected Returns: 10.4%
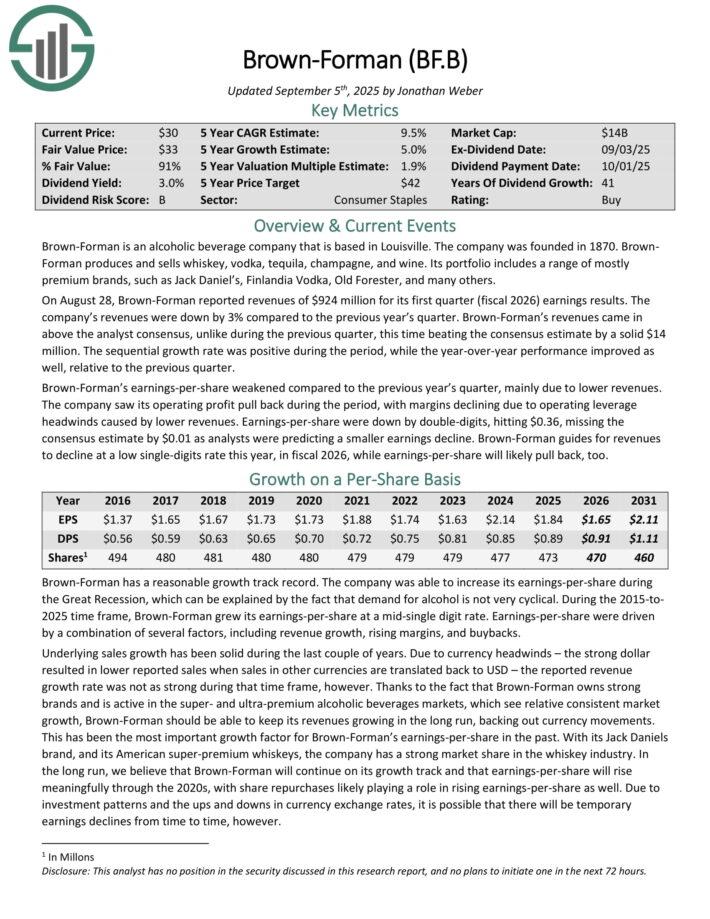
Brown-Forman is an alcoholic beverage company that is based in Louisville. The company was founded in 1870. It produces and sells whiskey, vodka, tequila, champagne, and wine.
Its portfolio includes a range of mostly premium brands, such as Jack Daniel’s, Finlandia Vodka, Old Forester, and many others.
On August 28, Brown-Forman reported revenues of $924 million for its first quarter (fiscal 2026) earnings results. The company’s revenues were down by 3% compared to the previous year’s quarter.
Revenues came in above the analyst consensus, unlike during the previous quarter, this time beating the consensus estimate by a solid $14 million. The sequential growth rate was positive during the period, while the year-over-year performance improved as well, relative to the previous quarter.
Brown-Forman’s earnings-per-share weakened compared to the previous year’s quarter, mainly due to lower revenues. The company saw its operating profit pull back during the period, with margins declining due to operating leverage headwinds caused by lower revenues.
Earnings-per-share were down by double-digits, hitting $0.36, missing the consensus estimate by $0.01 as analysts were predicting a smaller earnings decline.
Brown-Forman guides for revenues to decline at a low single-digits rate this year.
Click here to download our most recent Sure Analysis report on BF.B (preview of page 1 of 3 shown below):
Wealth Creation Stock #7: Lowe’s Cos., Inc. (LOW)
Annual Expected Returns: 10.8%
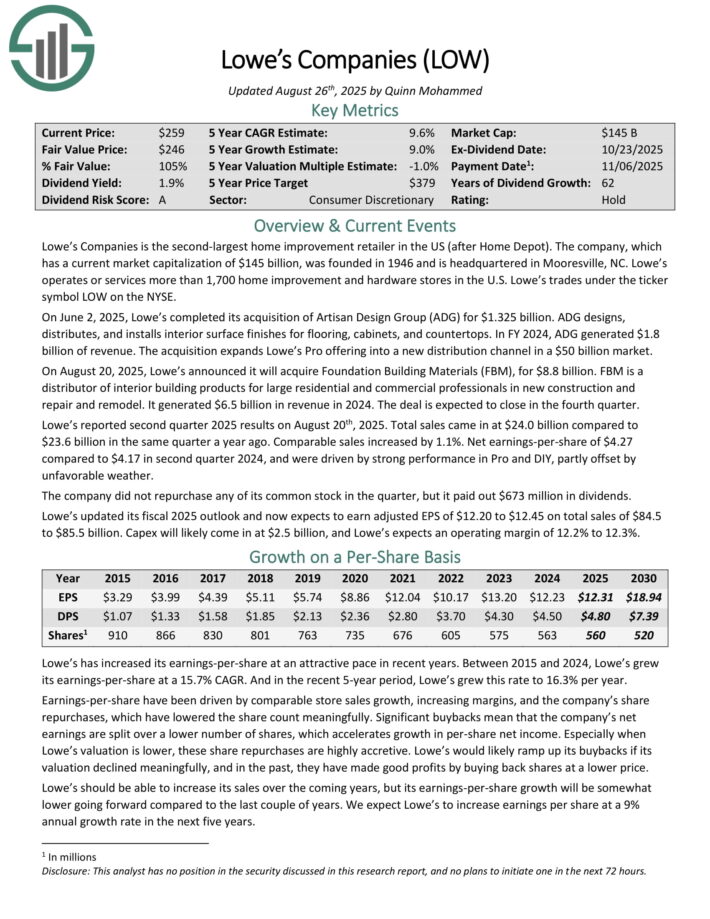
Lowe’s Companies is the second-largest home improvement retailer in the US (after Home Depot). The company was founded in 1946 and is headquartered in Mooresville, NC. Lowe’s operates or services more than 1,700 home improvement and hardware stores in the U.S.
On August 20, 2025, Lowe’s announced it will acquire Foundation Building Materials (FBM), for $8.8 billion. FBM is a distributor of interior building products for large residential and commercial professionals in new construction and repair and remodel. It generated $6.5 billion in revenue in 2024. The deal is expected to close in the fourth quarter.
Lowe’s reported second quarter 2025 results on August 20th, 2025. Total sales came in at $24.0 billion compared to $23.6 billion in the same quarter a year ago. Comparable sales increased by 1.1%. Net earnings-per-share of $4.27 compared to $4.17 in second quarter 2024, and were driven by strong performance in Pro and DIY, partly offset byunfavorable weather.
The company did not repurchase any of its common stock in the quarter, but it paid out $673 million in dividends. Lowe’s updated its fiscal 2025 outlook and now expects to earn adjusted EPS of $12.20 to $12.45 on total sales of $84.5 to $85.5 billion.
Click here to download our most recent Sure Analysis report on LOW (preview of page 1 of 3 shown below):
Wealth Creation Stock #6: T. Rowe Price (TROW)
Annual Expected Returns: 11.2%
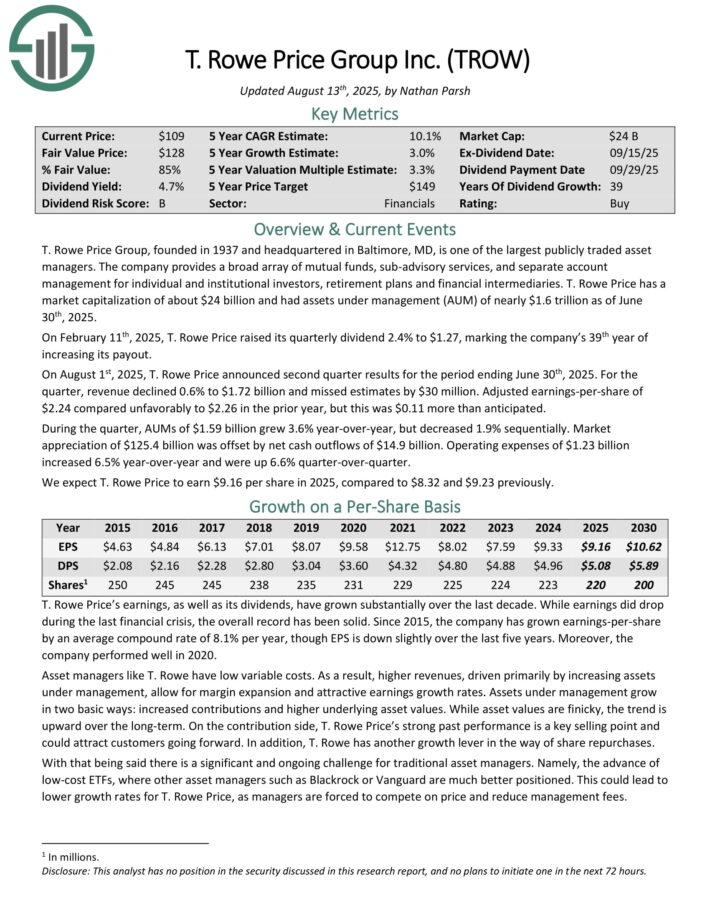
T. Rowe Price Group is one of the largest publicly traded asset managers. The company provides a broad array of mutual funds, sub-advisory services, and separate account management for individual and institutional investors, retirement plans and financial intermediaries.
T. Rowe Price had assets under management (AUM) of nearly $1.6 trillion as of June 30th, 2025.
On February 11th, 2025, T. Rowe Price raised its quarterly dividend 2.4% to $1.27, marking the company’s 39th year of increasing its payout.
On August 1st, 2025, T. Rowe Price announced second quarter results for the period ending June 30th, 2025. For the quarter, revenue declined 0.6% to $1.72 billion and missed estimates by $30 million. Adjusted earnings-per-share of $2.24 compared unfavorably to $2.26 in the prior year, but this was $0.11 more than anticipated.
During the quarter, AUMs of $1.59 billion grew 3.6% year-over-year, but decreased 1.9% sequentially. Market appreciation of $125.4 billion was offset by net cash outflows of $14.9 billion. Operating expenses of $1.23 billion increased 6.5% year-over-year and were up 6.6% quarter-over-quarter.
Click here to download our most recent Sure Analysis report on TROW (preview of page 1 of 3 shown below):
Wealth Creation Stock #5: Roper Technologies (ROP)
Annual Expected Returns: 11.2%
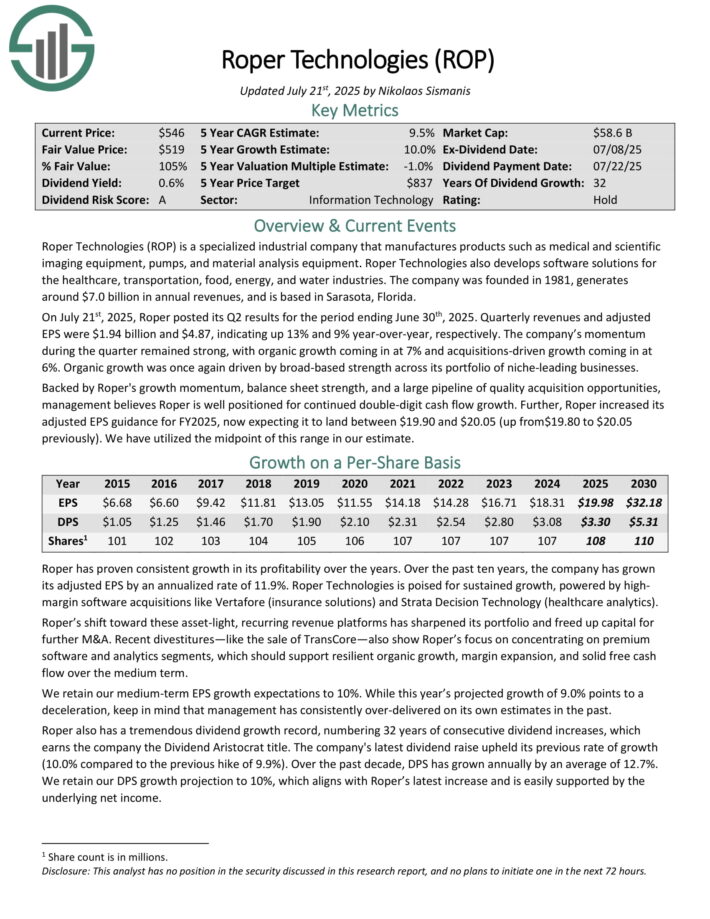
Roper Technologies is a specialized industrial company that manufactures products such as medical and scientific imaging equipment, pumps, and material analysis equipment.
Roper Technologies also develops software solutions for the healthcare, transportation, food, energy, and water industries. The company was founded in 1981, generates around $7.0 billion in annual revenues, and is based in Sarasota, Florida.
On July 21st, 2025, Roper posted its Q2 results for the period ending June 30th, 2025. Quarterly revenues and adjusted EPS were $1.94 billion and $4.87, indicating up 13% and 9% year-over-year, respectively.
The company’s momentum during the quarter remained strong, with organic growth coming in at 7% and acquisitions-driven growth coming in at 6%. Organic growth was once again driven by broad-based strength across its portfolio of niche-leading businesses.
Backed by Roper’s growth momentum, balance sheet strength, and a large pipeline of quality acquisition opportunities, management believes Roper is well positioned for continued double-digit cash flow growth.
Further, Roper increased its adjusted EPS guidance for FY2025, now expecting it to land between $19.90 and $20.05.
Click here to download our most recent Sure Analysis report on ROP (preview of page 1 of 3 shown below):
Wealth Creation Stock #4: W.W. Grainger (GWW)
Annual Expected Returns: 11.9%
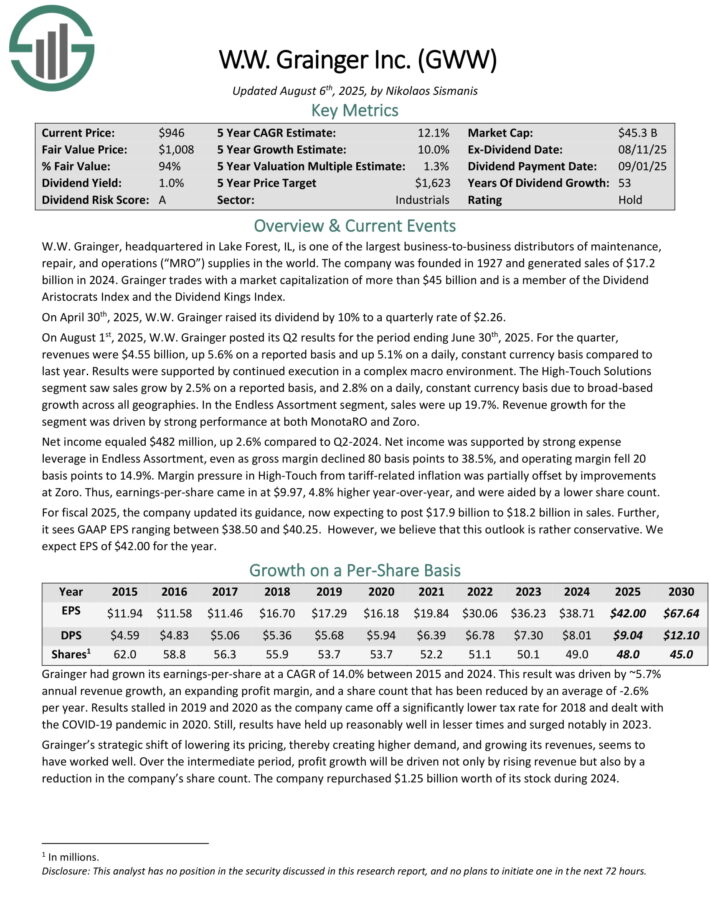
W.W. Grainger, headquartered in Lake Forest, IL, is one of the largest business-to-business distributors of maintenance, repair, and operations (“MRO”) supplies in the world. The company was founded in 1927 and generated sales of $17.2 billion in 2024.
On August 1st, 2025, W.W. Grainger posted its Q2 results for the period ending June 30th, 2025. For the quarter, revenues were $4.55 billion, up 5.6% on a reported basis and up 5.1% on a daily, constant currency basis compared to last year.
The High-Touch Solutions segment saw sales grow by 2.5% on a reported basis, and 2.8% on a daily, constant currency basis due to broad-based growth across all geographies.
In the Endless Assortment segment, sales were up 19.7%. Revenue growth for the segment was driven by strong performance at both MonotaRO and Zoro.
Net income equaled $482 million, up 2.6% compared to Q2-2024. Net income was supported by strong expense leverage in Endless Assortment, even as gross margin declined 80 basis points to 38.5%, and operating margin fell 20 basis points to 14.9%.
Margin pressure in High-Touch from tariff-related inflation was partially offset by improvements at Zoro. Earnings-per-share came in at $9.97, 4.8% higher year-over-year, and were aided by a lower share count.
Click here to download our most recent Sure Analysis report on GWW (preview of page 1 of 3 shown below):
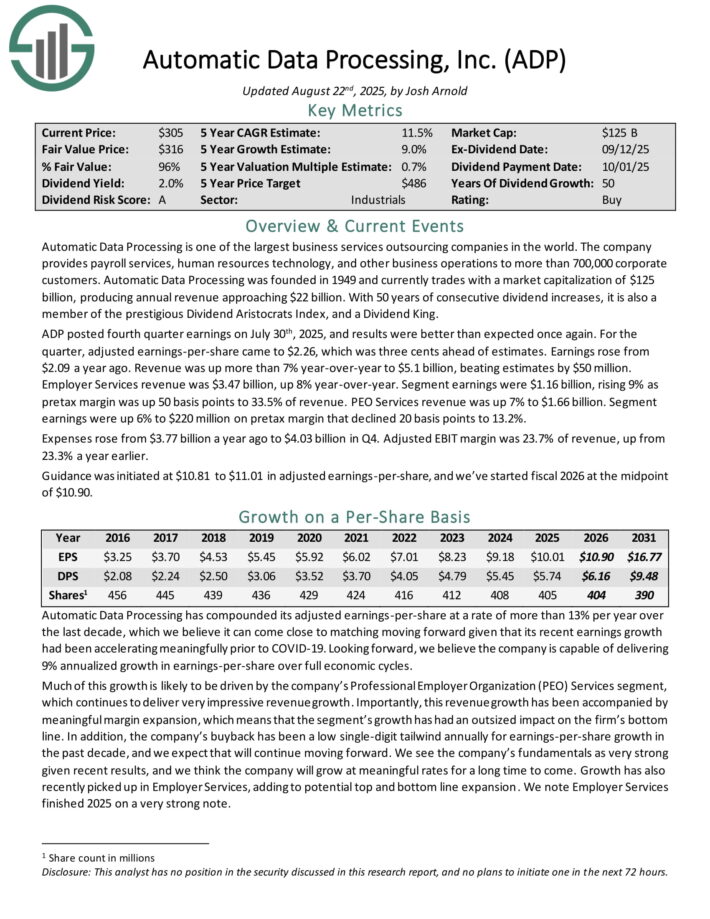
Wealth Creation Stock #3: Automatic Data Processing (ADP)
Annual Expected Returns: 13.4%
Automatic Data Processing is one of the largest business services outsourcing companies in the world. The company provides payroll services, human resources technology, and other business operations to more than 700,000 corporate customers.
Automatic Data Processing produces annual revenue of about $20 billion.
ADP posted fourth quarter earnings on July 30th, 2025, and results were better than expected once again. For the quarter, adjusted earnings-per-share came to $2.26, which was three cents ahead of estimates.
Earnings rose from $2.09 a year ago. Revenue was up more than 7% year-over-year to $5.1 billion, beating estimates by $50 million.
Employer Services revenue was $3.47 billion, up 8% year-over-year. Segment earnings were $1.16 billion, rising 9% as pretax margin was up 50 basis points to 33.5% of revenue.
PEO Services revenue was up 7% to $1.66 billion. Segment earnings were up 6% to $220 million on pretax margin that declined 20 basis points to 13.2%.
Expenses rose from $3.77 billion a year ago to $4.03 billion in Q4. Adjusted EBIT margin was 23.7% of revenue, up from 23.3% a year earlier. Guidance was initiated at $10.81 to $11.01 in adjusted earnings-per-share.
Click here to download our most recent Sure Analysis report on ADP (preview of page 1 of 3 shown below):
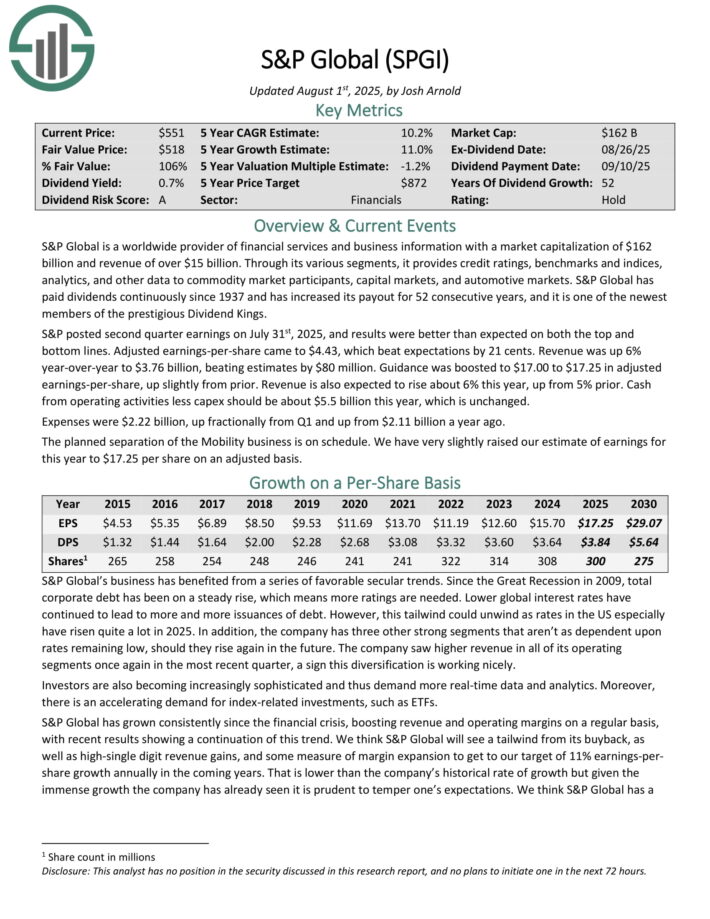
Wealth Creation Stock #2: S&P Global (SPGI)
Annual Expected Returns: 13.6%
S&P Global is a worldwide provider of financial services and business information with revenue of over $15 billion. Through its various segments, it provides credit ratings, benchmarks and indices, analytics, and other data to commodity market participants, capital markets, and automotive markets.
S&P Global has paid dividends continuously since 1937 and has increased its payout for 52 consecutive years.
S&P posted second quarter earnings on July 31st, 2025, and results were better than expected on both the top and bottom lines. Adjusted earnings-per-share came to $4.43, which beat expectations by 21 cents. Revenue was up 6% year-over-year to $3.76 billion, beating estimates by $80 million.
Guidance was boosted to $17.00 to $17.25 in adjusted earnings-per-share, up slightly from prior. Revenue is also expected to rise about 6% this year, up from 5% prior.
Cash from operating activities less capex should be about $5.5 billion this year, which is unchanged. Expenses were $2.22 billion, up fractionally from Q1 and up from $2.11 billion a year ago.
Click here to download our most recent Sure Analysis report on SPGI (preview of page 1 of 3 shown below):
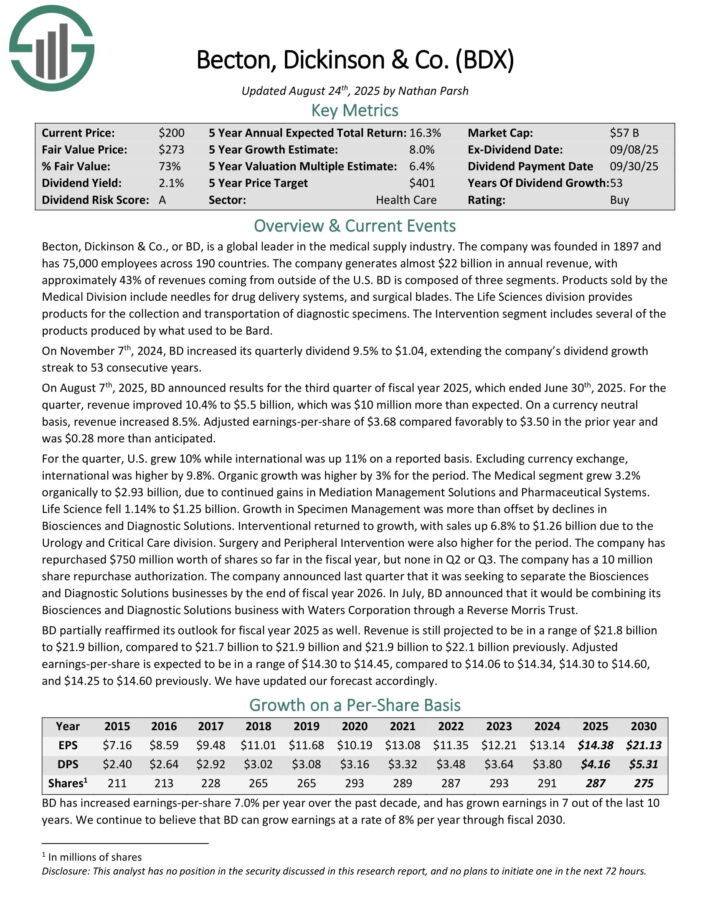
Wealth Creation Stock #1: Becton Dickinson & Co. (BDX)
Annual Expected Returns: 17.6%
Becton, Dickinson & Co. is a global leader in the medical supply industry. The company was founded in 1897 and has 75,000 employees across 190 countries.
The company generates about $20 billion in annual revenue, with approximately 43% of revenues coming from outside of the U.S.
Becton, Dickinson & Co., or BD, is a global leader in the medical supply industry. The company generates almost $22 billion in annual revenue, with approximately 43% of revenues coming from outside of the U.S.
On August 7th, 2025, BD announced results for the third quarter of fiscal year 2025, which ended June 30th, 2025. For the quarter, revenue improved 10.4% to $5.5 billion, which was $10 million more than expected.
On a currency neutral basis, revenue increased 8.5%. Adjusted earnings-per-share of $3.68 compared favorably to $3.50 in the prior year and was $0.28 more than anticipated.
For the quarter, U.S. grew 10% while international was up 11% on a reported basis. Excluding currency exchange, international was higher by 9.8%. Organic growth was higher by 3% for the period.
BD partially reaffirmed its outlook for fiscal year 2025 as well. Revenue is still projected to be in a range of $21.8 billion to $21.9 billion, compared to $21.7 billion to $21.9 billion previously. Adjusted earnings-per-share is expected to be in a range of $14.30 to $14.45.
Click here to download our most recent Sure Analysis report on BDX (preview of page 1 of 3 shown below):
Additional Reading
The following Sure Dividend databases contain the most reliable dividend growers in our investment universe:
Thanks for reading this article. Please send any feedback, corrections, or questions to [email protected].


")


")