

Updated on May 29th, 2025 by Bob Ciura
In the world of investing, volatility matters. Investors are reminded of this every time there is a downturn in the broader market and individual stocks that are more volatile than others experience enormous swings in price.
Volatility is a proxy for risk; more volatility generally means a riskier portfolio. The volatility of a security or portfolio against the mean is called standard deviation.
In short, standard deviation is an investing metric that calculates the magnitude of a security’s dispersion from its average price over a given time period.
As a result, we believe standard deviation is an important financial metric that investors should familiarize themselves with, when purchasing individual stocks.
To that end, we created a list of low volatility stocks. The list includes the 100 lowest standard deviation stocks in the S&P 500 Index.
You can download a spreadsheet of the 100 low volatility stocks (along with other important financial metrics like price-to-earnings ratios and dividend yields) by clicking on the link below:

This article will discuss standard deviation more thoroughly, and provide a discussion of the 5 lowest-volatility dividend stocks in the Sure Analysis Research Database.
The table of contents below allows for easy navigation.
Table of Contents
Standard Deviation Overview
Standard deviation is a calculation that involves a number of inputs, such as a security’s closing share prices over a given period of time, the mean value over that time, and the number of data points in the data set.
Why this matters is because investors can utilize standard deviation to get a better understanding of a security’s volatility, and therefore its risk.
Importantly, low or high standard deviation measures the size of the movements a security could make from its average performance.
In a normal distribution, a stock’s price action should fall within one standard distribution of its mean price, approximately 68% of the time.
Furthermore, the share price of the security in question, should be within two standard deviations of the mean, approximately 95% of the time.
To put this into perspective, assume a stock has a mean price of $100, and a standard deviation of $10. In a normal distribution, the stock in question should close between $80-$120 per share, approximately 95% of the time.
Of course, this still leaves a 5% chance that the stock will close outside the range of $80-$120. In this way, investors often use standard deviation as a proxy for risk.
The conventional wisdom would suggest that low volatility stocks should under-perform during market uptrends and outperform during downturns.
The following section discusses the 5 dividend-paying stocks in the S&P 500 with the lowest standard deviation of daily returns over the past five years.
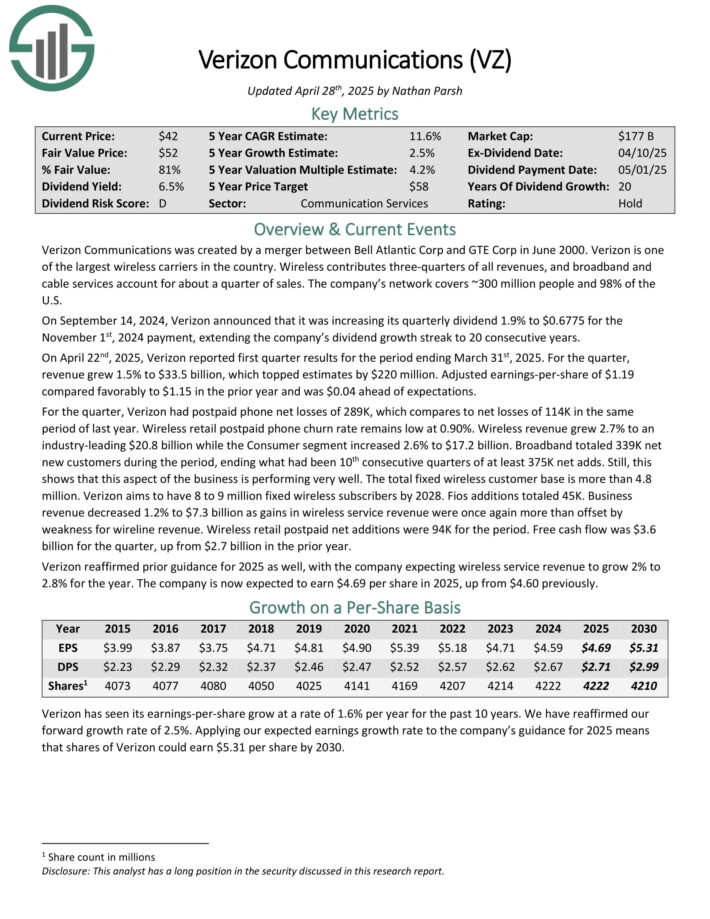
Low Volatility Stock #5: Verizon Communications (VZ)
5-Year Standard Deviation: 1.34%
Verizon Communications was created by a merger between Bell Atlantic Corp and GTE Corp in June 2000. Verizon is one of the largest wireless carriers in the country.
Wireless contributes three-quarters of all revenues, and broadband and cable services account for about a quarter of sales. The company’s network covers ~300 million people and 98% of the U.S.
On April 22nd, 2025, Verizon reported first quarter results for the period ending March 31st, 2025. For the quarter, revenue grew 1.5% to $33.5 billion, which topped estimates by $220 million.

Source: Investor Presentation
Adjusted earnings-per-share of $1.19 compared favorably to $1.15 in the prior year and was $0.04 ahead of expectations.
For the quarter, Verizon had postpaid phone net losses of 289K, which compares to net losses of 114K in the same period of last year. Wireless retail postpaid phone churn rate remains low at 0.90%.
Wireless revenue grew 2.7% to an industry-leading $20.8 billion while the Consumer segment increased 2.6% to $17.2 billion.
Broadband totaled 339K net new customers during the period, ending what had been 10th consecutive quarters of at least 375K net adds.
Click here to download our most recent Sure Analysis report on VZ (preview of page 1 of 3 shown below):
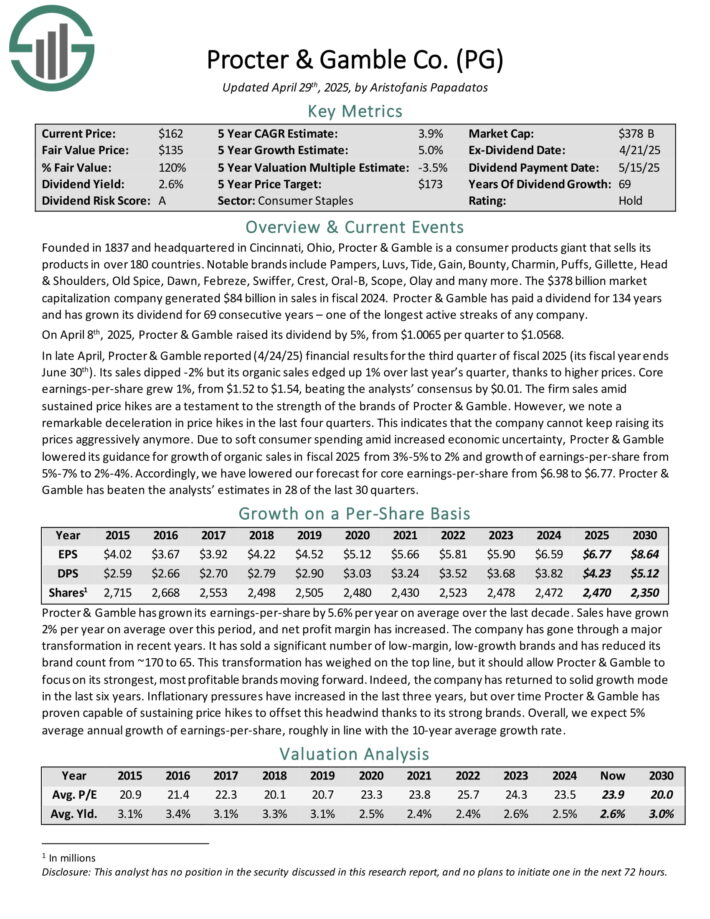
Low Volatility Stock #4: Procter & Gamble (PG)
5-Year Standard Deviation: 1.31%
Procter & Gamble is a consumer products giant that sells its products in over 180 countries.
Notable brands include Pampers, Luvs, Tide, Gain, Bounty, Charmin, Puffs, Gillette, Head & Shoulders, Old Spice, Dawn, Febreze, Swiffer, Crest, Oral-B, Scope, Olay and many more.
On April 8th, 2025, Procter & Gamble raised its dividend by 5%, from $1.0065 per quarter to $1.0568.
In late April, Procter & Gamble reported (4/24/25) financial results for the third quarter of fiscal 2025 (its fiscal year ends June 30th).
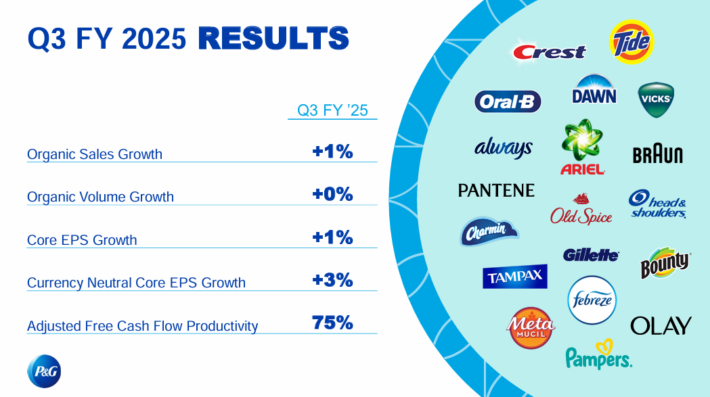
Source: Investor Presentation
Sales dipped -2% but its organic sales edged up 1% over last year’s quarter, thanks to higher prices.
Core earnings-per-share grew 1%, from $1.52 to $1.54, beating the analysts’ consensus by $0.01. The firm sales amid sustained price hikes are a testament to the strength of the brands of Procter & Gamble.
Click here to download our most recent Sure Analysis report on PG (preview of page 1 of 3 shown below):
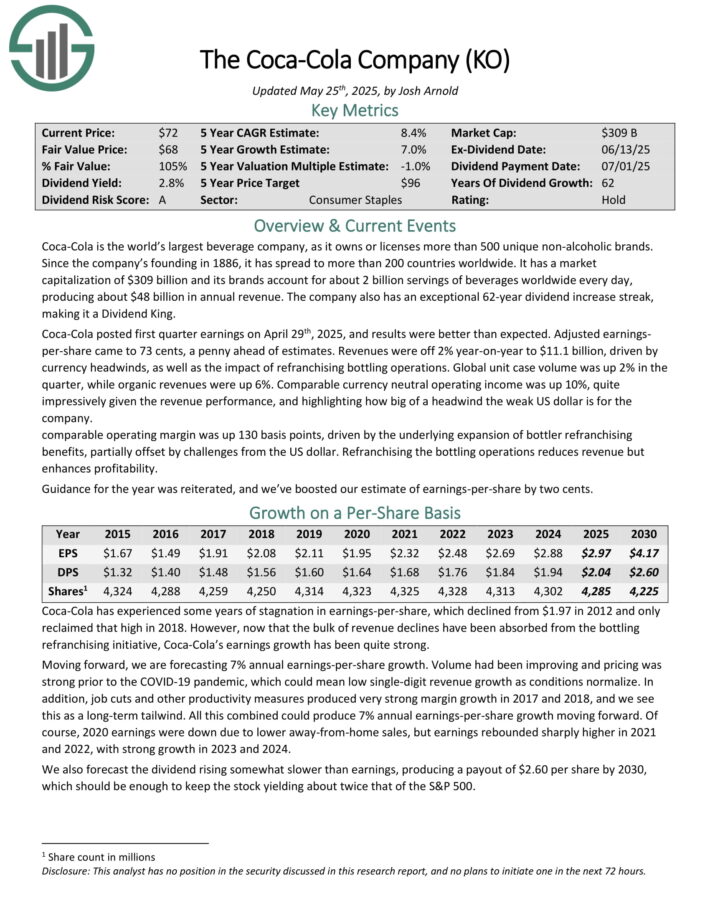
Low Volatility Stock #3: The Coca-Cola Company (KO)
5-Year Standard Deviation: 1.30%
Coca-Cola is the world’s largest beverage company, as it owns or licenses more than 500 unique non–alcoholic brands. Since the company’s founding in 1886, it has spread to more than 200 countries worldwide.
Coca-Cola now has 30 billion-dollar brands in its portfolio, which each generate at least $1 billion in annual sales.
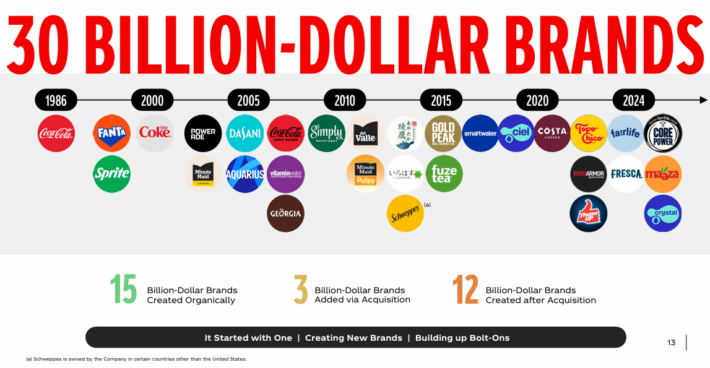
Source: Investor Presentation
Coca-Cola posted first quarter earnings on April 29th, 2025, and results were better than expected. Adjusted earnings per-share came to 73 cents, a penny ahead of estimates.
Revenues were off 2% year-on-year to $11.1 billion, driven by currency headwinds, as well as the impact of refranchising bottling operations. Global unit case volume was up 2% in the quarter, while organic revenues were up 6%.
Click here to download our most recent Sure Analysis report on KO (preview of page 1 of 3 shown below):
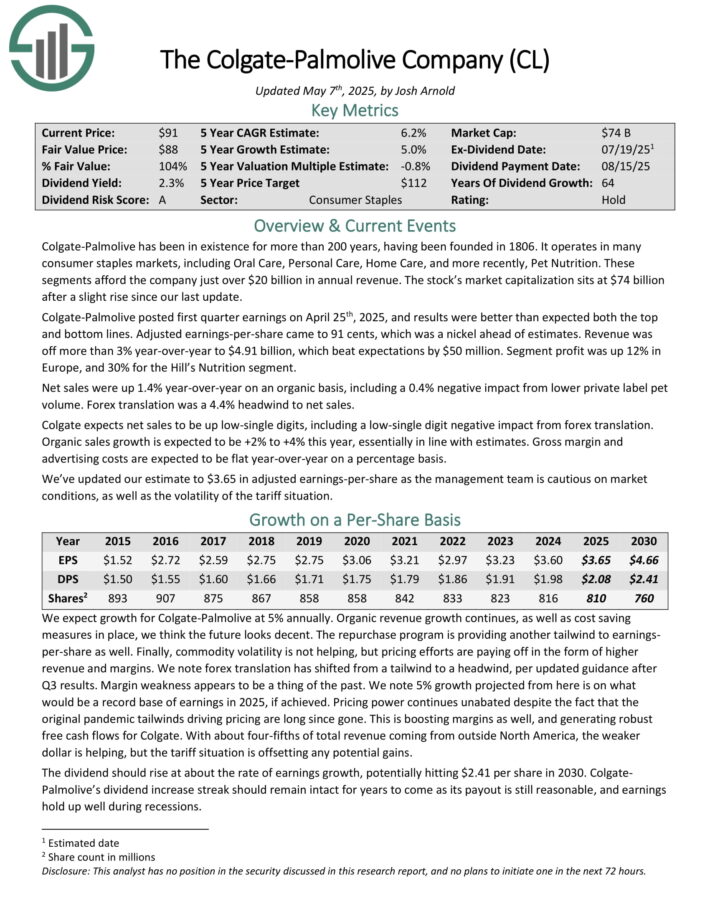
Low Volatility Stock #2: Colgate-Palmolive (CL)
5-Year Standard Deviation: 1.28%
Colgate-Palmolive was founded in 1806 and has built an impressive and extensive portfolio of consumer brands. It operates globally, selling in most countries around the world.
About one-sixth of its revenue comes from Hill’s pet food division, which has shown very strong growth in recent years.
The other five-sixths of revenue comes from a mix of cleaning and personal care products, with the company’s most recognizable brands being Colgate (tooth care) and Palmolive (soap).
The company has structured itself into four units: Oral Care, Personal Care, Home Care, and Pet Nutrition.
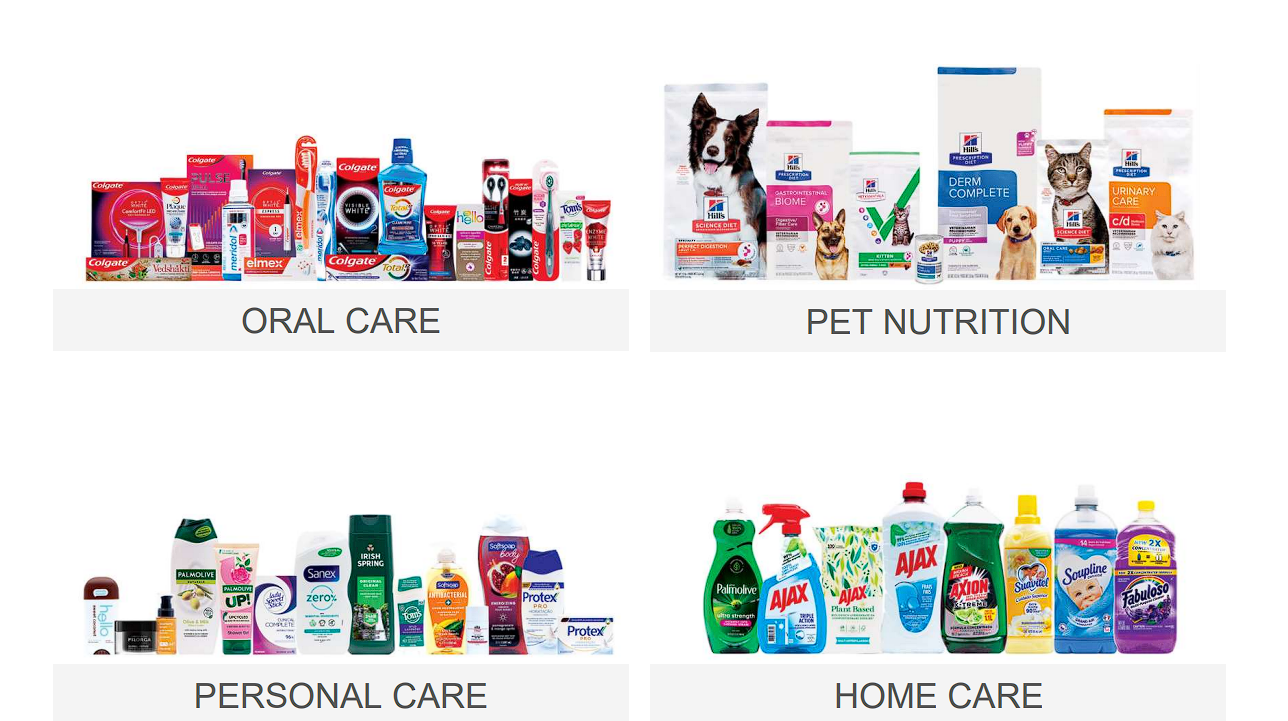
Source: Investor presentation
Colgate-Palmolive posted first quarter earnings on April 25th, 2025, and results were better than expected both the top and bottom lines. Adjusted earnings-per-share came to 91 cents, which was a nickel ahead of estimates.
Revenue was off more than 3% year-over-year to $4.91 billion, which beat expectations by $50 million. Segment profit was up 12% in Europe, and 30% for the Hill’s Nutrition segment.
Net sales were up 1.4% year-over-year on an organic basis, including a 0.4% negative impact from lower private label pet volume. Forex translation was a 4.4% headwind to net sales. Colgate expects net sales to be up low-single digits, including a low-single digit negative impact from forex translation. Organic sales growth is expected to be +2% to +4% this year.
Click here to download our most recent Sure Analysis report on CL (preview of page 1 of 3 shown below):
Low Volatility Stock #1: Johnson & Johnson (JNJ)
5-Year Standard Deviation: 1.23%
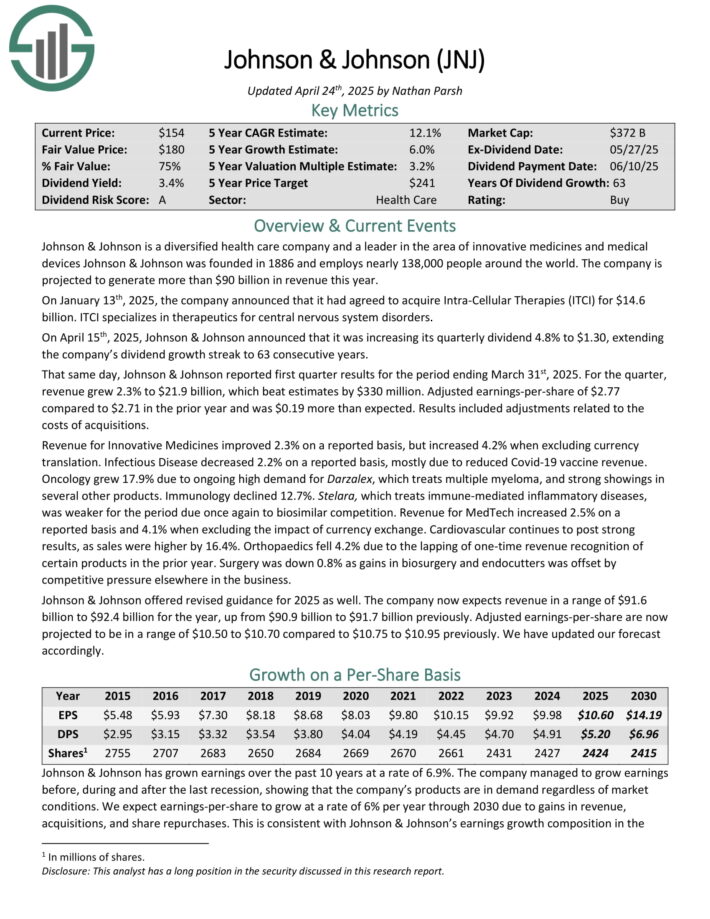
Johnson & Johnson is a diversified health care company and a leader in the area of innovative medicines and medical devices Johnson & Johnson was founded in 1886.
On April 15th, 2025, Johnson & Johnson announced that it was increasing its quarterly dividend 4.8% to $1.30, extending the company’s dividend growth streak to 63 consecutive years.
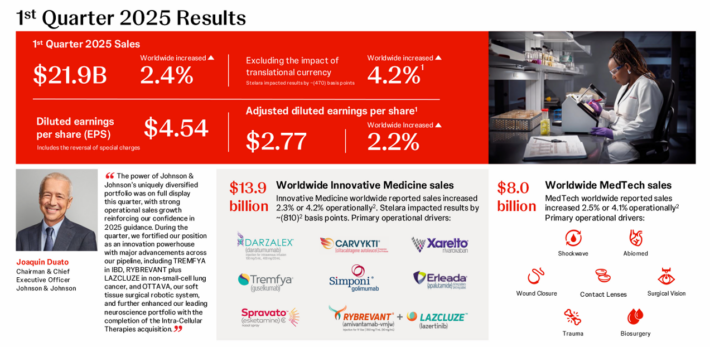
Source: Investor Presentation
That same day, Johnson & Johnson reported first quarter results for the period ending March 31st, 2025. For the quarter, revenue grew 2.3% to $21.9 billion, which beat estimates by $330 million.
Adjusted earnings-per-share of $2.77 compared to $2.71 in the prior year and was $0.19 more than expected. Results included adjustments related to the costs of acquisitions.
Click here to download our most recent Sure Analysis report on JNJ (preview of page 1 of 3 shown below):
Final Thoughts
Investors should take risk into account when purchasing individual stocks. After all, if two securities are otherwise similar in terms of expected returns but one offers a lower standard deviation, the investor would likely see stronger returns from the low volatility stock.
Standard deviation can help investors determine which securities will produce greater deviation from the market average.
The five stocks in the article not only have low standard deviation, but they also offer attractive dividend yields and total expected returns.
The following databases of dividend growth stocks may also be useful for income investors:
The Dividend Aristocrats List: dividend stocks with 25+ years of consecutive dividend increases
The High Yield Dividend Aristocrats List is comprised of the 20 Dividend Aristocrats with the highest current yields.
The Dividend Achievers List is comprised of ~400 stocks with 10+ years of consecutive dividend increases.
The Dividend Kings List is even more exclusive than the Dividend Aristocrats. It is comprised of 55 stocks with 50+ years of consecutive dividend increases.
The High Yield Dividend Kings List is comprised of the 20 Dividend Kings with the highest current yields.
The Blue Chip Stocks List: stocks that qualify as Dividend Achievers, Dividend Aristocrats, and/or Dividend Kings
The High Dividend Stocks List: stocks that appeal to investors interested in the highest yields of 5% or more.
The Monthly Dividend Stocks List: stocks that pay dividends every month, for 12 dividend payments per year.
The Dividend Champions List: stocks that have increased their dividends for 25+ consecutive years.Note: Not all Dividend Champions are Dividend Aristocrats because Dividend Aristocrats have additional requirements like being in The S&P 500.
Thanks for reading this article. Please send any feedback, corrections, or questions to [email protected].


