

Updated on November 12th, 2025 by Bob CiuraSpreadsheet data updated daily
The Dividend Kings are the best-of-the-best in dividend longevity.
What is a Dividend King? A stock with 50 or more consecutive years of dividend increases.
The downloadable Dividend Kings Spreadsheet List below contains the following for each stock in the index among other important investing metrics:
Payout ratio
Dividend yield
Price-to-earnings ratio
You can see the full downloadable spreadsheet of all 56 Dividend Kings (along with important financial metrics such as dividend yields, payout ratios, and price-to-earnings ratios) by clicking on the link below:

The Dividend Kings list includes recent additions such as MGE Energy (MGEE), RLI Corp. (RLI), and Automatic Data Processing (ADP).
Each Dividend King satisfies the primary requirement to be a Dividend Aristocrat (25 years of consecutive dividend increases) twice over.
Not all Dividend Kings are Dividend Aristocrats.
This unexpected result is because the ‘only’ requirement to be a Dividend Kings is 50+ years of rising dividends.
On the other hand, Dividend Aristocrats must have 25+ years of rising dividends, be a member of the S&P 500 Index, and meet certain minimum size and liquidity requirements.
Table of Contents
How To Use The Dividend Kings List to Find Dividend Stock Ideas
The Dividend Kings list is a great place to find dividend stock ideas. However, not all the stocks in the Dividend Kings list make a great investment at any given time.
Some stocks might be overvalued. Conversely, some might be undervalued – making great long-term holdings for dividend growth investors.
For those unfamiliar with Microsoft Excel, the following walk-through shows how to filter the Dividend Kings list for the stocks with the most attractive valuation based on the price-to-earnings ratio.
Step 1: Download the Dividend Kings Excel Spreadsheet.
Step 2: Follow the steps in the instructional video below. Note that we screen for price-to-earnings ratios of 15 or below in the video. You can choose any threshold that best defines ‘value’ for you.
Alternatively, following the instructions above and filtering for higher dividend yield Dividend Kings (yields of 2% or 3% or higher) will show stocks with 50+ years of rising dividends and above-average dividend yields.
Looking for businesses that have a long history of dividend increases isn’t a perfect way to identify stocks that will increase their dividends every year in the future, but there is considerable consistency in the Dividend Kings.
The 5 Best Dividend Kings Today
The following 5 stocks are our top-ranked Dividend Kings today, based on expected annual returns over the next 5 years. Stocks are ranked in order of lowest to highest expected annual returns.
Total returns include a combination of future earnings-per-share growth, dividends, and any changes in the P/E multiple.
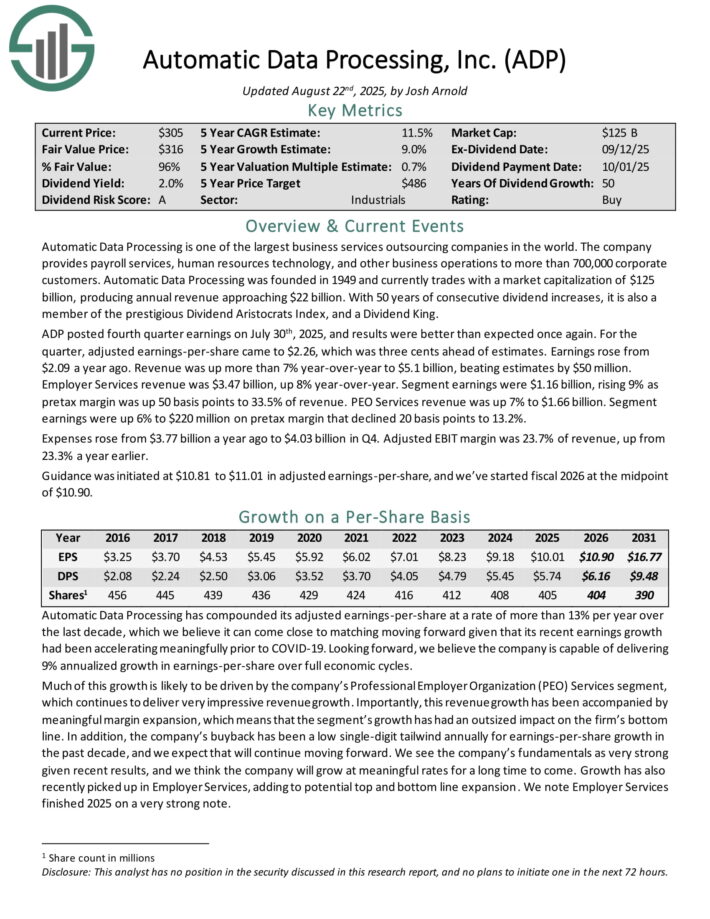
Dividend King #5: Automatic Data Processing (ADP)
5-Year Annual Expected Returns: 15.6%
Automatic Data Processing is one of the largest business services outsourcing companies in the world. The company provides payroll services, human resources technology, and other business operations to more than 700,000 corporate customers.
Automatic Data Processing produces annual revenue of about $20 billion.
ADP posted fourth quarter earnings on July 30th, 2025, and results were better than expected once again. For the quarter, adjusted earnings-per-share came to $2.26, which was three cents ahead of estimates.
Earnings rose from $2.09 a year ago. Revenue was up more than 7% year-over-year to $5.1 billion, beating estimates by $50 million.
Employer Services revenue was $3.47 billion, up 8% year-over-year. Segment earnings were $1.16 billion, rising 9% as pretax margin was up 50 basis points to 33.5% of revenue.
PEO Services revenue was up 7% to $1.66 billion. Segment earnings were up 6% to $220 million on pretax margin that declined 20 basis points to 13.2%.
Expenses rose from $3.77 billion a year ago to $4.03 billion in Q4. Adjusted EBIT margin was 23.7% of revenue, up from 23.3% a year earlier. Guidance was initiated at $10.81 to $11.01 in adjusted earnings-per-share.
Click here to download our most recent Sure Analysis report on ADP (preview of page 1 of 3 shown below):
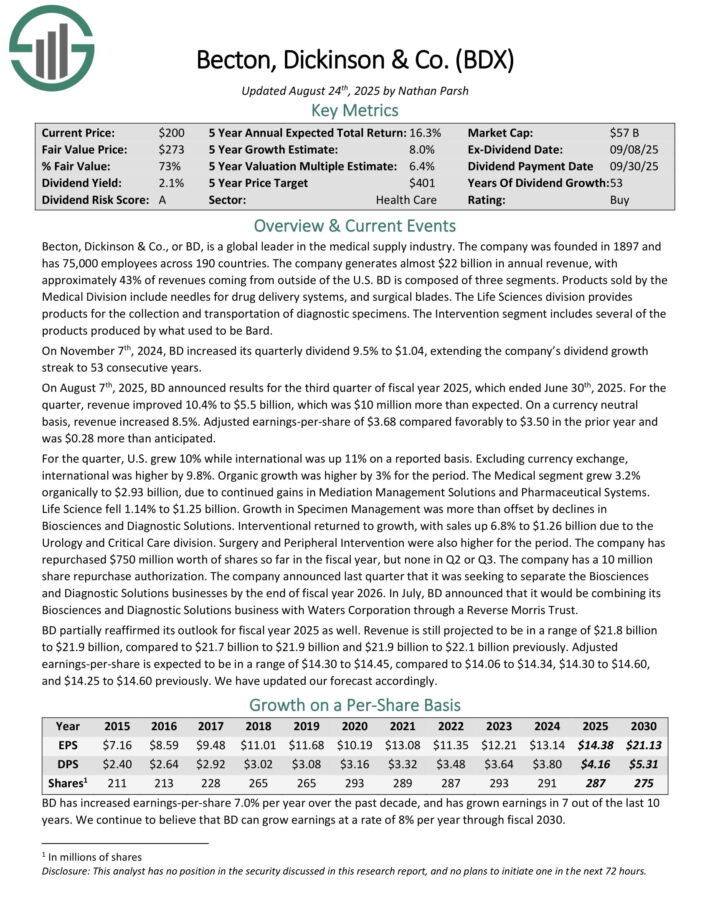
Dividend King #4: Becton Dickinson & Co. (BDX)
5-Year Annual Expected Returns: 17.6%
Becton, Dickinson & Co. is a global leader in the medical supply industry. The company was founded in 1897 and has 75,000 employees across 190 countries.
The company generates about $20 billion in annual revenue, with approximately 43% of revenues coming from outside of the U.S.
Becton, Dickinson & Co., or BD, is a global leader in the medical supply industry. The company generates almost $22 billion in annual revenue, with approximately 43% of revenues coming from outside of the U.S.
On August 7th, 2025, BD announced results for the third quarter of fiscal year 2025, which ended June 30th, 2025. For the quarter, revenue improved 10.4% to $5.5 billion, which was $10 million more than expected.
On a currency neutral basis, revenue increased 8.5%. Adjusted earnings-per-share of $3.68 compared favorably to $3.50 in the prior year and was $0.28 more than anticipated.
For the quarter, U.S. grew 10% while international was up 11% on a reported basis. Excluding currency exchange, international was higher by 9.8%. Organic growth was higher by 3% for the period.
The Medical segment grew 3.2% organically to $2.93 billion, due to continued gains in Mediation Management Solutions and Pharmaceutical Systems.
Life Science fell 1.14% to $1.25 billion. Growth in Specimen Management was more than offset by declines in Biosciences and Diagnostic Solutions. Interventional returned to growth, with sales up 6.8% to $1.26 billion due to the Urology and Critical Care division. Surgery and Peripheral Intervention were also higher for the period.
BD partially reaffirmed its outlook for fiscal year 2025 as well. Revenue is still projected to be in a range of $21.8 billion to $21.9 billion, compared to $21.7 billion to $21.9 billion and $21.9 billion to $22.1 billion previously. Adjusted earnings-per-share is expected to be in a range of $14.30 to $14.45.
Click here to download our most recent Sure Analysis report on BDX (preview of page 1 of 3 shown below):
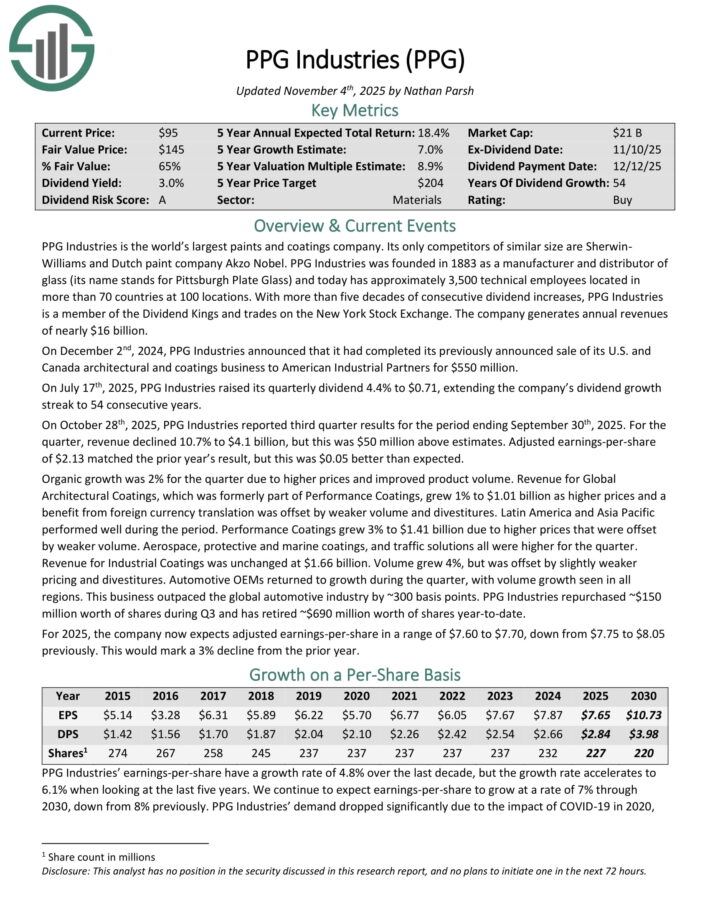
Dividend King #3: PPG Industries (PPG)
5-Year Annual Expected Returns: 18.2%
PPG Industries is the world’s largest paints and coatings company. Its only competitors of similar size are Sherwin-Williams and Dutch paint company Akzo Nobel.
PPG Industries was founded in 1883 as a manufacturer and distributor of glass (its name stands for Pittsburgh Plate Glass) and today has approximately 3,500 technical employees located in more than 70 countries at 100 locations.
On July 17th, 2025, PPG Industries raised its quarterly dividend 4.4% to $0.71, extending the company’s dividend growth streak to 54 consecutive years.
On October 28th, 2025, PPG Industries reported third quarter results for the period ending September 30th, 2025. For the quarter, revenue declined 10.7% to $4.1 billion, but this was $50 million above estimates. Adjusted earnings-per-share of $2.13 matched the prior year’s result, but this was $0.05 better than expected.
Organic growth was 2% for the quarter due to higher prices and improved product volume. Revenue for Global Architectural Coatings, which was formerly part of Performance Coatings, grew 1% to $1.01 billion as higher prices and a benefit from foreign currency translation was offset by weaker volume and divestitures.
Latin America and Asia Pacific performed well during the period. Performance Coatings grew 3% to $1.41 billion due to higher prices that were offset by weaker volume. Aerospace, protective and marine coatings, and traffic solutions all were higher for the quarter.
Revenue for Industrial Coatings was unchanged at $1.66 billion. Volume grew 4%, but was offset by slightly weaker pricing and divestitures. Automotive OEMs returned to growth during the quarter, with volume growth seen in all regions. This business outpaced the global automotive industry by ~300 basis points.
PPG Industries repurchased ~$150 million worth of shares during Q3 and has retired ~$690 million worth of shares year-to-date.
For 2025, the company now expects adjusted earnings-per-share in a range of $7.60 to $7.70.
Click here to download our most recent Sure Analysis report on PPG (preview of page 1 of 3 shown below):
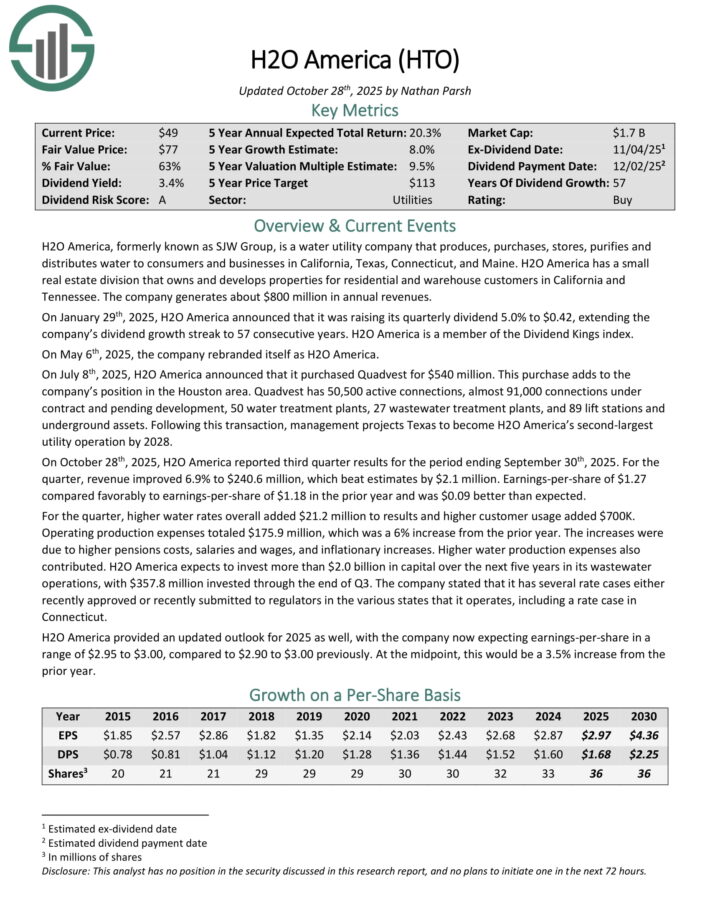
Dividend King #2: H2O America (HTO)
5-Year Annual Expected Returns: 21.2%
H2O America, formerly known as SJW Group, is a water utility company that produces, purchases, stores, purifies and distributes water to consumers and businesses in the Silicon Valley area of California, the area north of San Antonio, Texas, Connecticut, and Maine.
It also has a small real estate division that owns and develops properties for residential and warehouse customers in California and Tennessee. The company generates about $670 million in annual revenues.
On July 8th, 2025, H2O America announced that it purchased Quadvest for $540 million. This purchase adds to the company’s position in the Houston area.
Quadvest has 50,500 active connections, almost 91,000 connections under contract and pending development, 50 water treatment plants, 27 wastewater treatment plants, and 89 lift stations and underground assets.
On October 28th, 2025, H2O America reported third quarter results for the period ending September 30th, 2025. For the quarter, revenue improved 6.9% to $240.6 million, which beat estimates by $2.1 million.
Earnings-per-share of $1.27 compared favorably to earnings-per-share of $1.18 in the prior year and was $0.09 better than expected.
For the quarter, higher water rates overall added $21.2 million to results and higher customer usage added $700K. Operating production expenses totaled $175.9 million, which was a 6% increase from the prior year.
The increases were due to higher pensions costs, salaries and wages, and inflationary increases.
Click here to download our most recent Sure Analysis report on HTO (preview of page 1 of 3 shown below):
Dividend King #1: Stepan Co. (SCL)
5-Year Annual Expected Returns: 25.4%
Stepan manufactures basic and intermediate chemicals, including surfactants, specialty products, germicidal and fabric softening quaternaries, phthalic anhydride, polyurethane polyols and special ingredients for the food, supplement, and pharmaceutical markets.
It is organized into three distinct business lines: surfactants, polymers, and specialty products. These businesses serve a wide variety of end markets, meaning that Stepan is not beholden to just a handful of industries.
The surfactants business is Stepan’s largest by revenue, accounting for ~68% of total sales in the most recent quarter. A surfactant is an organic compound that contains both water-soluble and water-insoluble components.
Stepan posted second quarter earnings on July 30th, 2025, and results were much worse than expected on both the top and bottom lines. Adjusted earnings-per-share came to 52 cents, which was nowhere close to estimates for 90 cents. Revenue was up 7% year-over-year to $595 million, missing estimates by $3.6 million.
Surfactant sales were $412 million, with selling prices soaring 11% on pass-through of raw material costs, primarily. Sales volumes were down 1%. Polymers net sales were up 2% to $163 million. Volumes were up 7% but selling prices declined 7%. Specialty Product sales were $20.5 million, up 22%, but margins worsened.
Adjusted EBITDA was $51.4 million, up 8% year-over-year. Adjusted net income was $12 million. Cash from operations came to $11.2 million, and free cash flow was negative $14.4 million on higher working capital requirements, as well as raw material builds.
Click here to download our most recent Sure Analysis report on SCL (preview of page 1 of 3 shown below):

The Dividend Kings In Focus Series
You can see analysis on every single Dividend King below. The newest Sure Analysis Research Database report for each security is included as well.
Consumer Staples
Industrials
Health Care
Consumer Discretionary
Financials
Materials
Energy
Real Estate
Utilities
Performance Of The Dividend Kings
The Dividend Kings under-performed the S&P 500 ETF (SPY) in October 2025. Return data for the month is shown below:
Dividend Kings October 2025 total return: -2.1%
SPY October 2025 total return: 2.4%
Stable dividend growers like the Dividend Kings tend to underperform in bull markets and outperform on a relative basis during bear markets.
The Dividend Kings are not officially regulated and monitored by any one company. There’s no Dividend King ETF. This means that tracking the historical performance of the Dividend Kings can be difficult.
More specifically, performance tracking of the Dividend Kings often introduces significant survivorship bias.
Survivorship bias occurs when one looks at only the companies that ‘survived’ the time period in question. In the case of Dividend Kings, this means that the performance study does not include ex-Kings that reduced their dividend, were acquired, etc.
But with that said, there is something to be gained from investigating the historical performance of the Dividend Kings. Specifically, the performance of the Dividend Kings shows that ‘boring’ established blue-chip stocks that increase their dividend year-after-year can significantly outperform over long periods of time.
Notes: S&P 500 performance is measured using the S&P 500 ETF (SPY). The Dividend Kings performance is calculated using an equal weighted portfolio of today’s Dividend Kings, rebalanced annually. Due to insufficient data, Farmers & Merchants Bancorp (FMCB) returns are from 2000 onward. Performance excludes previous Dividend Kings that ended their streak of dividend increases which creates notable lookback/survivorship bias. The data for this study is from Ycharts.
In the next section of this article, we will provide an overview of the sector and market capitalization characteristics of the Dividend Kings.
Sector & Market Capitalization Overview
The sector and market capitalization characteristics of the Dividend Kings are very different from the characteristics of the broader stock market.
The following bullet points show the number of Dividend Kings in each sector of the stock market.
Consumer Staples: 14
Industrials: 12
Utilities: 9
Consumer Discretionary: 2
Health Care: 5
Financials: 6
Materials: 5
Real Estate: 1
Energy: 1
Communication Services: 0
The Dividend Kings are overweight in the Industrials, Consumer Staples, and Utilities sectors. Interestingly, The Dividend Kings have zero stocks from the Information Technology sector, which is the largest component of the S&P 500 index.
The Dividend Kings also have some interesting characteristics with respect to market capitalization. These trends are illustrated below.
6 Mega caps ($200 billion+ market cap; ABT, ABBV, JNJ, PG, KO, WMT)
26 Large caps ($10 billion to $200 billion market cap)
16 Mid caps ($2 billion to $10 billion)
8 Small caps ($300 million to $2 billion)
Interestingly, 25 out of the 56 Dividend Kings have market capitalizations below $10 billion. This shows that corporate longevity doesn’t have to be accompanied by massive size.
Final Thoughts
Screening to find the best Dividend Kings is not the only way to find high-quality dividend growth stock ideas.
Sure Dividend maintains similar databases on the following useful universes of stocks:
There is nothing magical about investing in the Dividend Kings. They are simply a group of high-quality businesses with shareholder-friendly management teams that have strong competitive advantages.
Purchasing businesses with these characteristics at fair or better prices and holding them for long periods of time will likely result in strong long-term investment performance.
Thanks for reading this article. Please send any feedback, corrections, or questions to [email protected].


 (Rookie Reply)")


