

Updated on October 28th, 2025 by Bob Ciura
The Dividend Discount Model is a valuation formula used to find the fair value of a dividend stock.
“Everything should be as simple as it can be, but not simpler”– Attributed to Albert Einstein
The elegance of the dividend discount model is its simplicity. The dividend discount model requires only 3 inputs to find the fair value of a dividend paying stock.
1-year forward dividend
Growth rate
Discount rate
If you prefer learning through videos, you can watch a step-by-step tutorial on how to implement the dividend discount model below:
Dividend Discount Model Formula
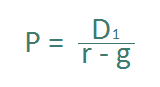
The formula for the dividend discount model is:

The dividend discount model is calculated as follows. It is next year’s expected dividend divided by an appropriate discount rate, less the expected dividend growth rate.
This is abbreviated as:
Alternate Names of the Dividend Discount Model
The dividend discount model is often referred to by 3 other names:
Dividend Growth Model
Gordon Growth Model
Dividend Valuation Model
The Dividend Growth Model, Gordon Growth Model, and Dividend Valuation Model all refer to the Dividend Discount Model.
Myron Gordon and Eli Shapiro created the dividend discount model at the University of Toronto in 1956.
How The Dividend Discount Model Works
The dividend discount model works off the idea that the fair value of an asset is the sum of its future cash flows discounted back to fair value with an appropriate discount rate.
Dividends are future cash flows for investors.
Imagine a business paying $1.00 in dividends per year, forever. How much would you pay for this business if you wanted to make 10% return on your investment every year?
Note: Here’s a free investment calculator.
10% is your discount rate. The fair value of this business according to the dividend discount model is $10 ($1 divided by 10%).
We can see this is accurate. A $10 investment that pays $1 every year creates a return of 10% a year – exactly what you required.
The dividend discount model tells us how much we should pay for a stock for a given required rate of return.
Estimating Required Return Using the CAPM
CAPM stands for Capital Asset Pricing Model. It is a critical financial concept to understand. The capital asset pricing model shows the inverse relationship between risk and return.
The required return for any given stock according to the CAPM is calculated with the formula below:
![]()
![]()
The difference between the market return and the risk free rate is known as the market risk premium. What is the current market risk premium?
The long-term, inflation-adjusted return of the stock market not accounting for dividends is 2.6%. Inflation is expected to be at 2.3% over the next decade. The current dividend yield on the S&P 500 is 1.1%.
Therefore, a fair estimate of market return to use in the CAPM formula is 6.0%, which is the sum of (2.6% + 2.3% + 1.1%).
The current risk free rate is 4.1%. The risk-free rate is calculated as the yield on 1-month T-Bills. This results in a market risk premium of 1.9%.
All that is left to calculate the required return on any stock using the CAPM is beta. Beta over a 10-year period is below for 3 Dividend Aristocrats:
These betas imply a required return of:
Aflac has a required return of 5.7%
PepsiCo has a required return of 5.0%
Archer-Daniels-Midland has a required return of 5.4%
Stock beta values have a significant effect on the required returns of different stocks. We used Yahoo Finance for beta values.
The Importance of The Dividend Growth Rate
The dividend growth rate is critically important in determining the fair value of a stock with the dividend discount model.
The denominator of the dividend discount model is discount rate minus growth rate. The growth rate must be less than the discount rate for the dividend discount model to function. If the growth rate estimate is greater than the discount rate the dividend discount model will return a negative value.
There are no stocks worth any negative value. The lowest value a stock can have is $0 (bankruptcy with no sellable assets).
Changes in the estimated growth rate of a business change its value under the dividend discount model.
In the example below, next year’s dividend is expected to be $1 multiplied by 1 + the growth rate. The discount rate is 10%:
$4.79 value at -9% growth rate
$5.88 value at -6% growth rate
$7.46 value at -3% growth rate
$10.00 value at 0% growth rate
$14.71 value at 3% growth rate
$26.50 value at 6% growth rate
$109.00 value at 9% growth rate
Longer Growth Rates Push Value Out In Time
The closer the growth rate is to the discount rate, the more time it takes to approach the present value of discounted future cash flows.
The chart below shows the percentage of fair value reached through time for different growth rates. A discount rate of 10% and an expected dividend of $1 multiplied by $1 + the growth rate is used.
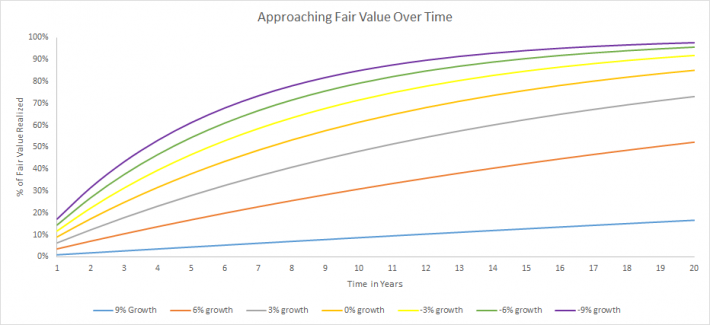
Businesses with a wide gap between the discount rate and the growth rate converge on their fair value faster. There is a hidden advantage here. You don’t have to be right for as long.
If you have a required return of 10% and estimate dividend growth at 0% a year (no growth) it would take 8 years for discounted cash flows to reach ~50% (53%, exactly) of fair value.
With a 9% growth rate, only 7% of fair value is reached after 8 years. The business will have to grow at 9% for… 75 years to reach 50% of its fair value. Growth rates are difficult to calculate over 1 year. How anyone can push growth rates out 50 or 75 years and have any confidence in them is beyond me.
It is impossible to have any idea what a business will be doing in 75 years, even in extremely stable industries. At best, we can say a business will probably exist in 75 years. Saying it will still be growing at 9% a year in 75 years is impractical.
Estimating The Dividend Growth Rate
The dividend growth rate must approximate the growth rate of the business over long time periods. If dividend growth exceeded business growth for long dividends will be more than 100% of cash flows. This is impossible over any meaningful length of time.
Long-term earnings-per-share growth approximates long-term dividend per share growth.
Using earnings-per-share growth over dividend-per-share growth has a distinct advantage. Dividend growth can be inaccurate due to 1 time increases in payout ratio.
A company can raise its payout ratio from 35% to 70% and double its dividend. The company cannot repeat the same trick over the next period. The payout ratio cannot double again from 70% to 140% (at least, it can’t if it wants to stay in business).
It is easier to estimate future growth rates for established businesses. A business like PepsiCo will probably grow around the same rate over the next decade as it has over the last decade.
Rapidly growing businesses like Amazon (AMZN) cannot grow at 20% or more annually forever. If Amazon grew its market cap at 20% a year over the next 30 years it would be worth more than $400 trillion.
To put that into perspective, the global GDP is currently around $100 trillion. Rapidly growing businesses’ growth rates should be reduced to more accurately reflect future growth.
Dividend Discount Model Excel Spreadsheet Calculator
Download a free Excel Spreadsheet dividend discount model calculator at the link below:
Dividend Discount Model Excel Spreadsheet Calculator
The calculator has detailed instruction inside the spreadsheet on how to use it.
The Implied Dividend Growth Rate
The dividend discount model can tell us the implied dividend growth rate of a business using:
Current market price
Beta
Reasonable estimate of next year’s dividend.
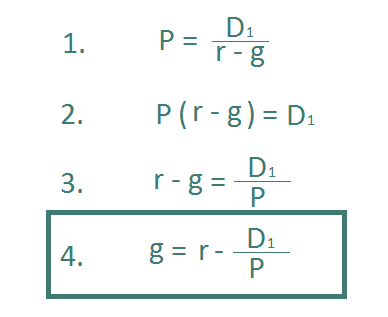
To do so we need only rearrange the dividend discount model formula to solve for growth rather than price.
Let’s use Walmart (WMT) as an example:
Share price of $104
Estimated dividend next year of $0.99 per share
Beta value of 0.67
Using the Beta above with our previously-calculated 6.0% expected market return and 4.1% risk-free rate gives us a CAPM required return of 5.4% to use for our discount rate.
Plugging these numbers into the implied dividend growth formula gives an implied dividend growth rate for Walmart of 4.45%.
Comparing the implied growth rate to reasonable growth expectations can turn up potentially undervalued securities.
Walmart is a high-quality dividend stock, due to its long track record of growth, and above average dividend yield.
Click the link below to download an implied growth rate dividend discount model calculator:
Implied Growth Rate Excel Spreadsheet Calculator
Shortcomings of the Dividend Discount Model
While the dividend discount model is a very useful exercise to value dividend growth stocks, as with any model, there are multiple shortcomings that investors should consider.
First, the dividend discount model values a stock in perpetuity. The reality is that no business exists forever. The model ascribes a positive value (albeit negligible) to dividends paid 100+ years from now.
We am firm believers in long-term investing. Making 100+ year forecasts is foolish, even for the longest of long-term investors.
Furthermore, the dividend discount model does not work on businesses that do not pay dividends. Amazon (AMZN) certainly has a positive value, even though it does not currently pay dividends.
This shortcoming makes the dividend discount model a useful tool only for dividend paying stocks (as the name implies).
The dividend discount model says the fair value of a business is the sum of its future cash flows discounted to present value.
Another potential shortcoming is that the dividend discount model fails to account for cash flows from selling your shares. Using Alphabet again as an example, the company invests its cash flows into growth, not paying dividends to shareholders.
If the company can grow earnings-per-share at 15% a year, its stock price should (in theory) grow at 15% a year as well. When investors sell the stock they will generate a very real cash flow. The dividend discount model does not account for this.
The model also does not take into account changing payout ratios. Some businesses may raise or lower their target payout ratio. This meaningfully affects the fair value calculation of the dividend discount model.
Lastly, calculating the ‘fair’ discount rate is also a serious drawback to the dividend discount model. You can know your expected return, but not what the overall expected return of the market should be.
The CAPM does a poor job of coming up with real world discount rates.
Final Thoughts
The dividend discount model has serious flaws; but so does every other valuation metric. Investing is an art, not a science. There is no one perfect way to invest.
The dividend discount model is a useful tool to gauge assumptions about a dividend stock. It is not the final word on valuation, but it does provide a different way to look at and value dividend stocks.
This article contains spreadsheet downloads for the implied growth rate and for the dividend discount model. They are listed below:
Additional Reading
If you are interested in finding high-quality dividend growth stocks suitable for long-term investment, the following Sure Dividend databases will be useful:
The Dividend Achievers List is comprised of ~400 stocks with 10+ years of consecutive dividend increases.
The Dividend Kings List is even more exclusive than the Dividend Aristocrats. It is comprised of 56 stocks with 50+ years of consecutive dividend increases.
The High Yield Dividend Kings List is comprised of the 20 Dividend Kings with the highest current yields.
The Blue Chip Stocks List: stocks that qualify as Dividend Achievers, Dividend Aristocrats, and/or Dividend Kings
The High Dividend Stocks List: stocks that appeal to investors interested in the highest yields of 5% or more.
The Monthly Dividend Stocks List: stocks that pay dividends every month, for 12 dividend payments per year.
The High Yield Monthly Dividend Stocks List: the 20 monthly dividend stocks with the highest current yields.
The Dividend Champions List: stocks that have increased their dividends for 25+ consecutive years.Note: Not all Dividend Champions are Dividend Aristocrats because Dividend Aristocrats have additional requirements like being in The S&P 500.
Thanks for reading this article. Please send any feedback, corrections, or questions to [email protected].


 Q3 2026 Earnings Results")


