

Updated on December 2nd, 2025 by Bob Ciura
Many that follow the dividend growth investment strategy aim to live off the income their portfolio provides in retirement.
We believe that those that follow this strategy can have a more worry-free retirement experience as the investor’s portfolio can provide income regardless of the state of the economy.
This is why we believe that investors should focus on owning high-quality dividend-paying stocks such as the Dividend Aristocrats, which are those companies that have raised their dividends for at least 25 consecutive years.
Membership in this group is so exclusive that just 69 companies qualify as Dividend Aristocrat.
We have compiled a list of all Dividend Aristocrats and relevant financial metrics like dividend yield and P/E ratios.
You can download the full list of Dividend Aristocrats by clicking on the link below:

Disclaimer: Sure Dividend is not affiliated with S&P Global in any way. S&P Global owns and maintains The Dividend Aristocrats Index. The information in this article and downloadable spreadsheet is based on Sure Dividend’s own review, summary, and analysis of the S&P 500 Dividend Aristocrats ETF (NOBL) and other sources, and is meant to help individual investors better understand this ETF and the index upon which it is based. None of the information in this article or spreadsheet is official data from S&P Global. Consult S&P Global for official information.
In a perfect world, investors would receive the same or similar amount of income from their portfolio every month as expenses are usually consistent.
But this is not the case as many companies typically distribute their dividends at the end of each quarter, which is usually in March, June, September, and December.
This can make for uneven cash flows throughout the year, which presents some issues for investors that require similar income month-to-month.
Still, investors can construct a diversified portfolio with high-quality, dividend-paying stocks that can provide similar amounts of income every month of the year.
To that end, we have created a model portfolio of 15 stocks. Each stock has at least nine years of dividend growth, with the average position having a dividend growth streak of 25 years.
Stocks were selected from various sectors, giving the investor a diversified portfolio that would provide income each month of the year.
January, April, July, and October Payments
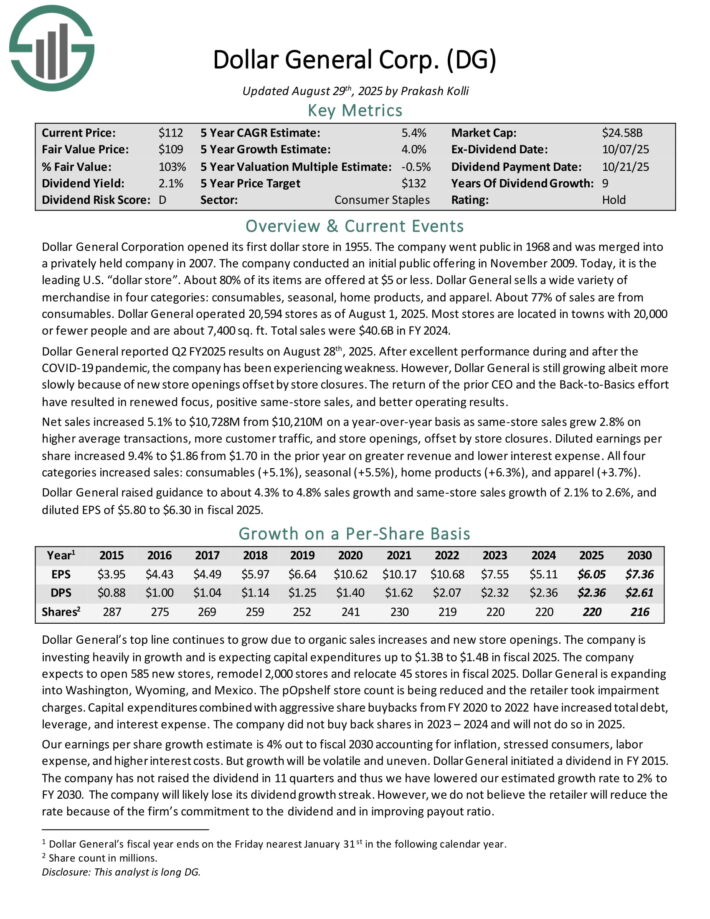
Dollar General (DG)
Dollar General Corporation opened its first dollar store in 1955. Today, it is the leading U.S. “dollar store”. About 80% of its items are offered at $5 or less.
Dollar General sells a wide variety of merchandise in four categories: consumables, seasonal, home products, and apparel. About 77% of sales are from consumables. Dollar General operated 20,594 stores as of August 1, 2025.
Most stores are located in towns with 20,000 or fewer people and are about 7,400 sq. ft. Total sales were $40.6B in FY 2024.
Dollar General reported Q2 FY2025 results on August 28th, 2025. Net sales increased 5.1% to $10,728M from $10,210M on a year-over-year basis as same-store sales grew 2.8% on higher average transactions, more customer traffic, and store openings, offset by store closures.
Diluted earnings per share increased 9.4% to $1.86 from $1.70 in the prior year on greater revenue and lower interest expense. All four categories increased sales: consumables (+5.1%), seasonal (+5.5%), home products (+6.3%), and apparel (+3.7%).
Dollar General raised guidance to about 4.3% to 4.8% sales growth and same-store sales growth of 2.1% to 2.6%, and diluted EPS of $5.80 to $6.30 in fiscal 2025.
Click here to download our most recent Sure Analysis report on DG (preview of page 1 of 3 shown below):
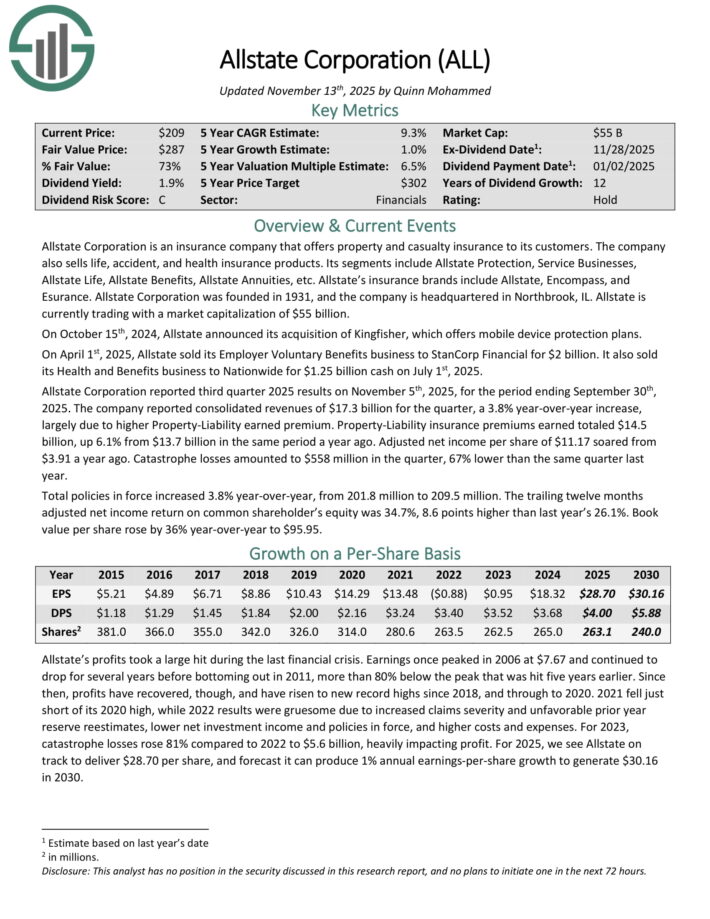
Allstate Corporation (ALL)
Allstate Corporation is an insurance company that offers property and casualty insurance to its customers. The company also sells life, accident, and health insurance products.
Its segments include Allstate Protection, Service Businesses, Allstate Life, Allstate Benefits, Allstate Annuities, etc. Allstate’s insurance brands include Allstate, Encompass, and Esurance.
Allstate Corporation reported third quarter 2025 results on November 5th, 2025. The company reported consolidated revenues of $17.3 billion for the quarter, a 3.8% year-over-year increase, largely due to higher Property-Liability earned premium.
Property-Liability insurance premiums earned totaled $14.5 billion, up 6.1% from $13.7 billion in the same period a year ago. Adjusted net income per share of $11.17 soared from $3.91 a year ago.
The insurance industry is not a high-growth industry, nevertheless, Allstate has managed to grow earnings successfully over the long term, with ebbs and flows over certain time periods.
The company benefits from rising interest rates, as this allows it to deploy its insurance float more profitably.
Allstate has successfully reduced its share count throughout the last decade, and it is likely that share repurchases will remain a key factor in earnings-per-share growth going forward as well.
In the last five years, the company has reduced its common shares outstanding by 4.1% annually.
Click here to download our most recent Sure Analysis report on ALL (preview of page 1 of 3 shown below):
PepsiCo, Inc. (PEP)
PepsiCo is a global food and beverage company that generates $89 billion in annual sales. The company’s products include Pepsi, Mountain Dew, Frito-Lay chips, Gatorade, Tropicana orange juice and Quaker foods.
The company has more than 20 $1 billion brands in its portfolio. On February 4th, 2025, PepsiCo increased its annualized dividend by 5.0% to $5.69 starting with the payment that was made in June 2025, extending the company’s dividend growth streak to 53 consecutive years.
On October 9th, 2025, PepsiCo reported third quarter earnings results for the period ending September 30th, 2025. For the quarter, revenue grew 2.7% to $23.9 billion, which beat estimates by $90 million. Adjusted earnings-per-share of $2.29 compared unfavorably to $2.31 the prior year, but this was $0.03 better than expected.
Organic sales grew 1.3% for the third quarter. For the period, volumes for both beverages and foods were down 1%. PepsiCo Beverages North America’s organic revenue grew 2% for the period even as volume declined by 3%.
Revenue for PepsiCo Foods North America decreased 3%, largely due to divestitures. Food volume decreased 4%. The International Beverages segment fell 1%, primarily due to lower volume. Revenues in Europe/Middle East/Africa were up 5.5%. Food volume declined 1%, but this was offset by a 1.5% gain in beverages.
PepsiCo reaffirmed prior guidance for 2025, with the company still expecting organic sales in the low single-digit range.
Click here to download our most recent Sure Analysis report on PEP (preview of page 1 of 3 shown below):

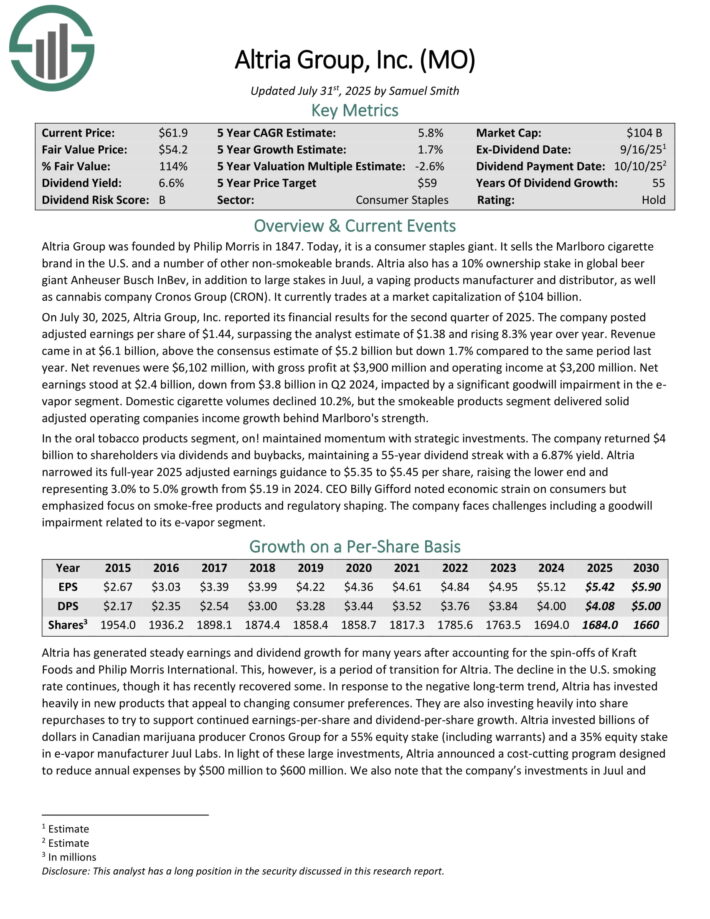
Altria Group (MO)
Altria is a tobacco stock that sells cigarettes, chewing tobacco, cigars, e-cigarettes, and more under a variety of brands, including Marlboro, Skoal, and Copenhagen, among others.
This is a period of transition for Altria. The decline in the U.S. smoking rate continues. In response, Altria has invested heavily in new products that appeal to changing consumer preferences, as the smoke-free category continues to grow.
The company also has a 35% investment stake in e-cigarette maker JUUL, and a 45% stake in the Canadian cannabis producer Cronos Group (CRON).
On July 30, 2025, Altria Group, Inc. reported its financial results for the second quarter of 2025. The company posted adjusted earnings per share of $1.44, surpassing the analyst estimate of $1.38 and rising 8.3% year over year.
Revenue came in at $6.1 billion, above the consensus estimate of $5.2 billion but down 1.7% compared to the same period last year. Net revenues were $6,102 million, with gross profit at $3,900 million and operating income at $3,200 million.
Net earnings stood at $2.4 billion, down from $3.8 billion in Q2 2024, impacted by a significant goodwill impairment in the e-vapor segment.
Domestic cigarette volumes declined 10.2%, but the smokeable products segment delivered solid adjusted operating companies income growth behind Marlboro’s strength.
Click here to download our most recent Sure Analysis report on Altria (preview of page 1 of 3 shown below):
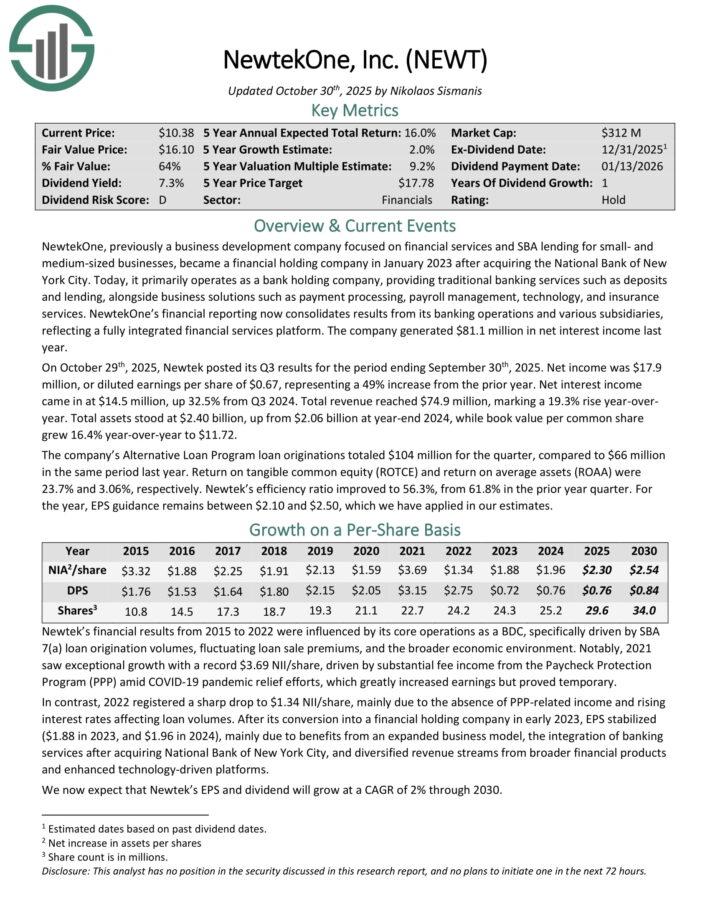
NewtekOne Inc. (NEWT)
NewtekOne, previously a business development company focused on financial services and SBA lending for small- and medium-sized businesses, became a financial holding company in January 2023 after acquiring the National Bank of New York City.
Today, it primarily operates as a bank holding company, providing traditional banking services such as deposits and lending, alongside business solutions such as payment processing, payroll management, technology, and insurance services.
NewtekOne’s financial reporting now consolidates results from its banking operations and various subsidiaries, reflecting a fully integrated financial services platform. The company generated $81.1 million in net interest income last year.
On October 29th, 2025, Newtek posted its Q3 results. Net income was $17.9 million, or diluted earnings per share of $0.67, representing a 49% increase from the prior year. Net interest income came in at $14.5 million, up 32.5% from Q3 2024.
Total revenue reached $74.9 million, marking a 19.3% rise year-over-year. Total assets stood at $2.40 billion, up from $2.06 billion at year-end 2024, while book value per common share grew 16.4% year-over-year to $11.72.
The company’s Alternative Loan Program loan originations totaled $104 million for the quarter, compared to $66 million in the same period last year. Return on tangible common equity (ROTCE) and return on average assets (ROAA) were 23.7% and 3.06%, respectively.
Click here to download our most recent Sure Analysis report on NEWT (preview of page 1 of 3 shown below):
February, May, August, and November Payments
Comcast Corporation (CMCSA)
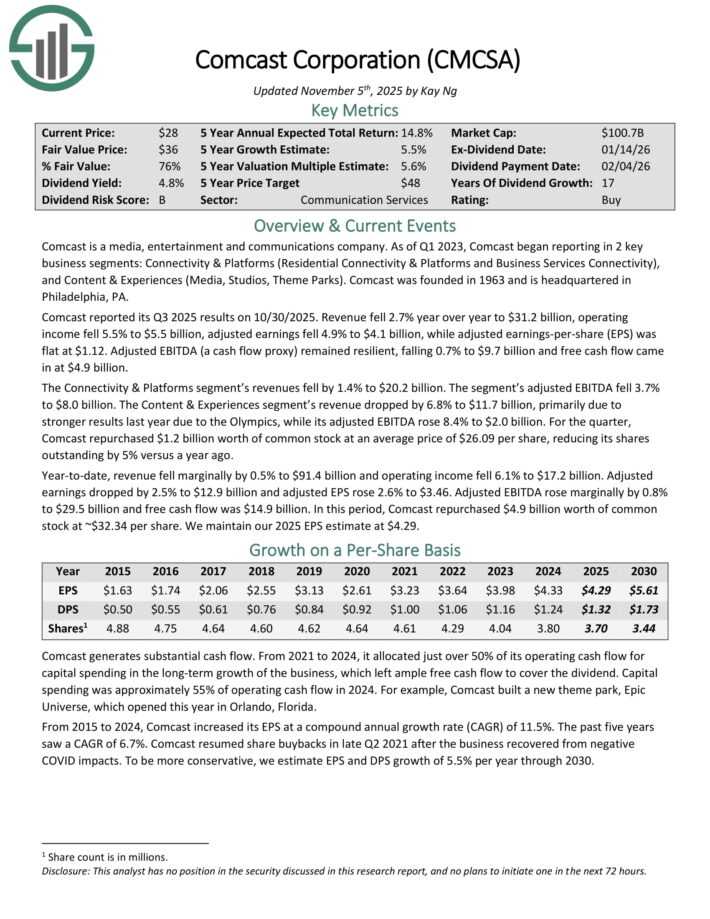
Comcast is a media, entertainment and communications company. Comcast has two key business segments: Connectivity & Platforms (Residential Connectivity & Platforms and Business Services Connectivity), and Content & Experiences (Media, Studios, Theme Parks).
Comcast reported its Q3 2025 results on 10/30/2025. Revenue fell 2.7% year over year to $31.2 billion, operating income fell 5.5% to $5.5 billion, adjusted earnings fell 4.9% to $4.1 billion, while adjusted earnings-per-share (EPS) was flat at $1.12.
The Connectivity & Platforms segment’s revenues fell by 1.4% to $20.2 billion. The segment’s adjusted EBITDA fell 3.7% to $8.0 billion. The Content & Experiences segment’s revenue dropped by 6.8% to $11.7 billion, primarily due to stronger results last year due to the Olympics, while its adjusted EBITDA rose 8.4% to $2.0 billion.
For the quarter, Comcast repurchased $1.2 billion worth of common stock at an average price of $26.09 per share, reducing its shares outstanding by 5% versus a year ago.
Click here to download our most recent Sure Analysis report on Comcast (preview of page 1 of 3 shown below):
Verizon Communications (VZ)
Verizon Communications is one of the largest wireless carriers in the country. Wireless contributes three-quarters of all revenues, and broadband and cable services account for about a quarter of sales. The company’s network covers ~300 million people and 98% of the U.S.
On September 5th, 2025, Verizon announced that it was increasing its quarterly dividend 1.8% to $0.69 for the November 3rd, 2025 payment, extending the company’s dividend growth streak to 21 consecutive years.
On October 29th, 2025, Verizon reported third quarter results for the period ending September 30th, 2025. For the quarter, revenue grew 1.5% to $33.8 billion, but this was $470 million below estimates. Adjusted earnings-per-share of $1.21 compared favorably to $1.19 in the prior year and was $0.02 better than expected.
For the quarter, Verizon Consumer had postpaid phone net losses of 7,000, which compares to net additions of 18,000 in the same period of last year. However, wireless retail core prepaid net additions grew 47,000, marking the fifth consecutive quarter of positive subscriber growth.
Consumer wireless retail postpaid phone churn rate remains low at 0.91%. The Consumer segment grew 2.9% to $26.1 billion while consumer wireless service revenue increased 2.4% to $17.4 billion. Consumer wireless postpaid average revenue per account grew 2.0% to $147.91.
Broadband totaled 306K net new customers during the period, which marks 13 consecutive quarters of at least 300K net adds. The total fixed wireless customer base is almost 5.4 million. Verizon aims to have 8 to 9 million fixed wireless subscribers by 2028.
Wireless retail postpaid net additions were 110K for the period. Free cash flow was $15.8 billion for the first three quarters of the year, up from $14.5 billion for the same period in 2024.
Verizon reaffirmed prior guidance for 2025 as well, with the company still expecting wireless service revenue to grow 2% to 2.8% for the year. Verizon is also expected to produce adjusted EPS growth in a range of 1% to 3%.
Click here to download our most recent Sure Analysis report on VZ (preview of page 1 of 3 shown below):

Lowe’s Companies (LOW)
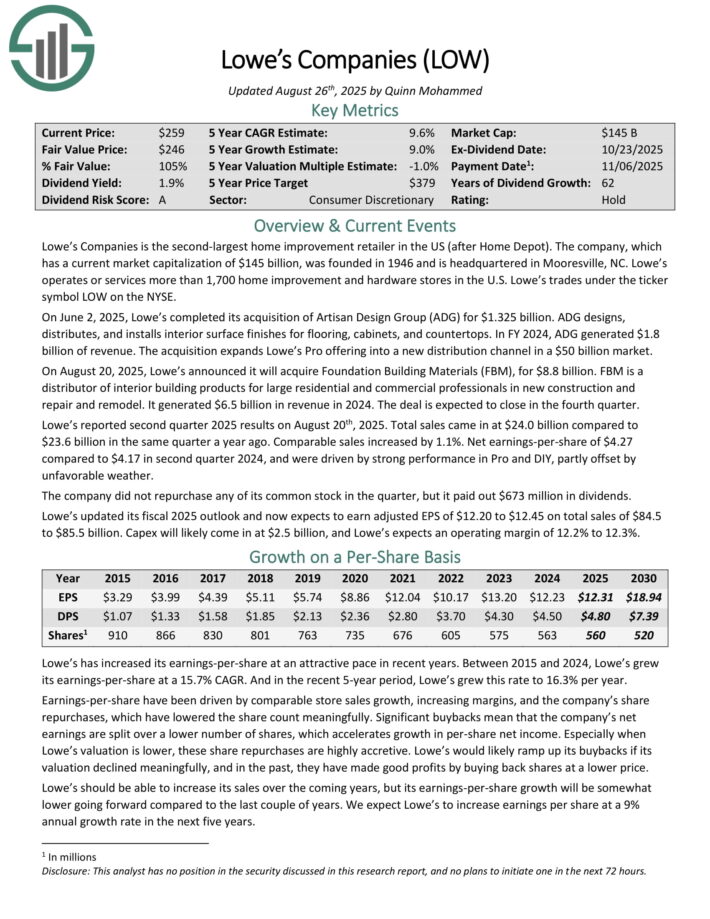
Lowe’s Companies is the second-largest home improvement retailer in the US (after Home Depot). The company was founded in 1946 and is headquartered in Mooresville, NC. Lowe’s operates or services more than 1,700 home improvement and hardware stores in the U.S.
On August 20, 2025, Lowe’s announced it will acquire Foundation Building Materials (FBM), for $8.8 billion. FBM is a distributor of interior building products for large residential and commercial professionals in new construction and repair and remodel. It generated $6.5 billion in revenue in 2024. The deal is expected to close in the fourth quarter.
Lowe’s reported second quarter 2025 results on August 20th, 2025. Total sales came in at $24.0 billion compared to $23.6 billion in the same quarter a year ago. Comparable sales increased by 1.1%. Net earnings-per-share of $4.27 compared to $4.17 in second quarter 2024, and were driven by strong performance in Pro and DIY, partly offset byunfavorable weather.
The company did not repurchase any of its common stock in the quarter, but it paid out $673 million in dividends. Lowe’s updated its fiscal 2025 outlook and now expects to earn adjusted EPS of $12.20 to $12.45 on total sales of $84.5 to $85.5 billion.
Click here to download our most recent Sure Analysis report on LOW (preview of page 1 of 3 shown below)
H2O America (HTO)
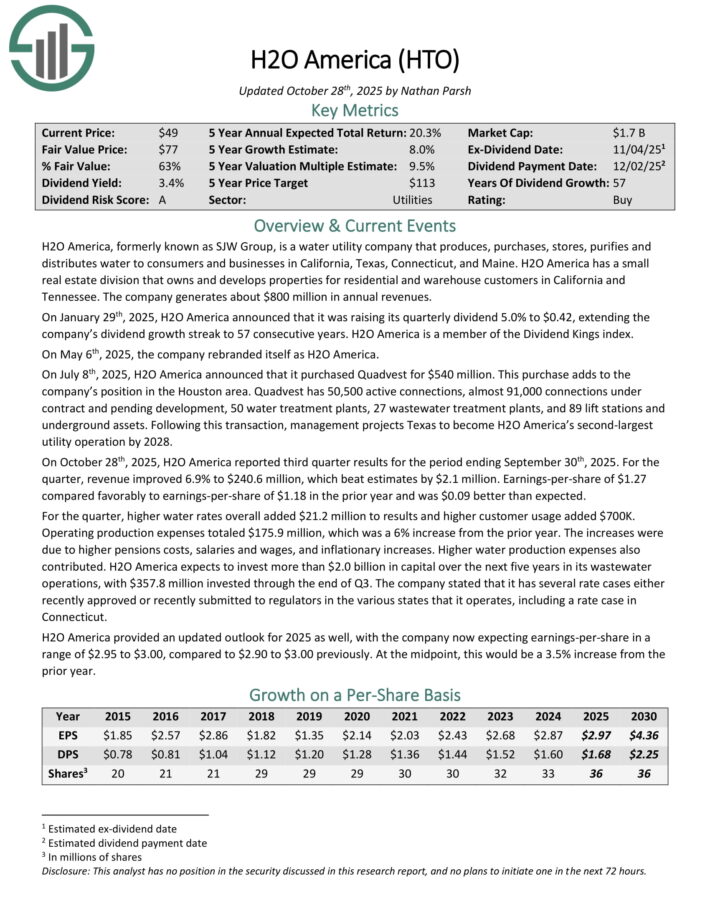
H2O America, formerly known as SJW Group, is a water utility company that produces, purchases, stores, purifies and distributes water to consumers and businesses in the Silicon Valley area of California, the area north of San Antonio, Texas, Connecticut, and Maine.
It also has a small real estate division that owns and develops properties for residential and warehouse customers in California and Tennessee. The company generates about $670 million in annual revenues.
On July 8th, 2025, H2O America announced that it purchased Quadvest for $540 million. This purchase adds to the company’s position in the Houston area.
Quadvest has 50,500 active connections, almost 91,000 connections under contract and pending development, 50 water treatment plants, 27 wastewater treatment plants, and 89 lift stations and underground assets.
On October 28th, 2025, H2O America reported third quarter results for the period ending September 30th, 2025. For the quarter, revenue improved 6.9% to $240.6 million, which beat estimates by $2.1 million.
Earnings-per-share of $1.27 compared favorably to earnings-per-share of $1.18 in the prior year and was $0.09 better than expected.
For the quarter, higher water rates overall added $21.2 million to results and higher customer usage added $700K. Operating production expenses totaled $175.9 million, which was a 6% increase from the prior year.
The increases were due to higher pensions costs, salaries and wages, and inflationary increases.
Click here to download our most recent Sure Analysis report on HTO (preview of page 1 of 3 shown below):
Procter & Gamble Co. (PG)
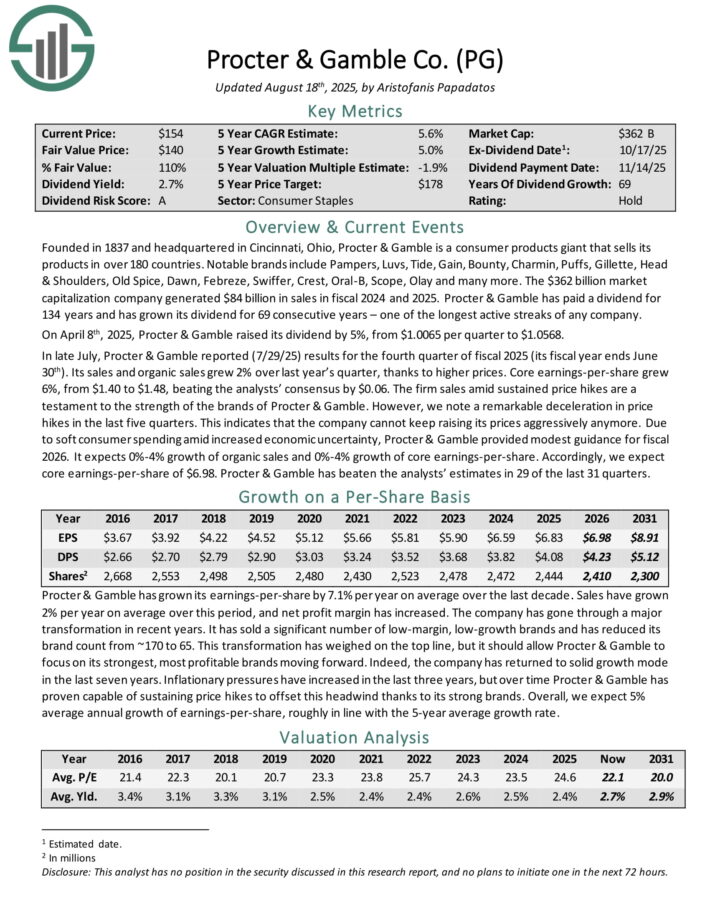
Procter & Gamble is a consumer products giant that sells its products in over 180 countries. Notable brands include Pampers, Luvs, Tide, Gain, Bounty, Charmin, Puffs, Gillette, Head & Shoulders, Old Spice, Dawn, Febreze, Swiffer, Crest, Oral-B, Scope, Olay and many more.
The company generated $84 billion in sales in fiscal 2024 and 2025. Procter & Gamble has paid a dividend for 134 years and has grown its dividend for 69 consecutive years – one of the longest active streaks of any company.
In late July, Procter & Gamble reported (7/29/25) results for the fourth quarter of fiscal 2025 (its fiscal year ends June 30th). Its sales and organic sales grew 2% over last year’s quarter, thanks to higher prices. Core earnings-per-share grew 6%, from $1.40 to $1.48, beating the analysts’ consensus by $0.06.
The firm sales amid sustained price hikes are a testament to the strength of the brands of Procter & Gamble. However, we note a remarkable deceleration in price hikes in the last five quarters. This indicates that the company cannot keep raising its prices aggressively anymore.
Due to soft consumer spending amid increased economic uncertainty, Procter & Gamble provided modest guidance for fiscal 2026. It expects 0%-4% growth of organic sales and 0%-4% growth of core earnings-per-share.
Click here to download our most recent Sure Analysis report on PG (preview of page 1 of 3 shown below):
March, June, September, and December Payments
Dover Corporation (DOV)
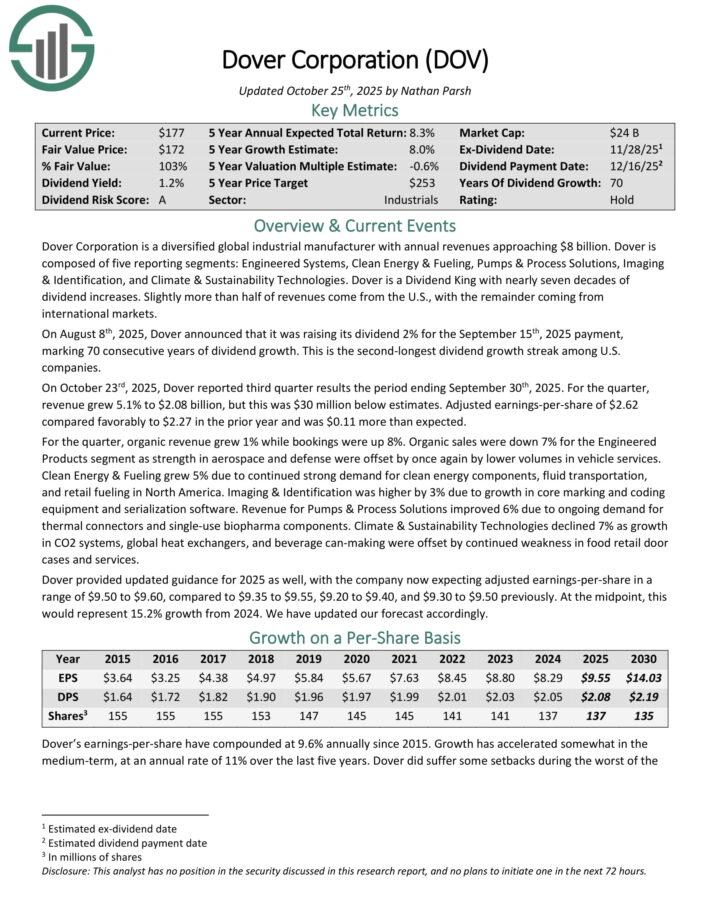
Dover Corporation is a diversified global industrial manufacturer with annual revenue approaching $8 billion. Dover is composed of five reporting segments: Engineered Systems, Clean Energy & Fueling, Pumps & Process Solutions, Imaging & Identification, and Climate & Sustainability Technologies.
On August 8th, 2025, Dover announced that it was raising its dividend 2% for the September 15th, 2025 payment, marking 70 consecutive years of dividend growth. This is the second-longest dividend growth streak among U.S. companies.
On October 23rd, 2025, Dover reported third quarter results the period ending September 30th, 2025. For the quarter, revenue grew 5.1% to $2.08 billion, but this was $30 million below estimates. Adjusted earnings-per-share of $2.62 compared favorably to $2.27 in the prior year and was $0.11 more than expected.
For the quarter, organic revenue grew 1% while bookings were up 8%. Organic sales were down 7% for the Engineered Products segment as strength in aerospace and defense were offset by once again by lower volumes in vehicle services.
Clean Energy & Fueling grew 5% due to continued strong demand for clean energy components, fluid transportation, and retail fueling in North America. Imaging & Identification was higher by 3% due to growth in core marking and coding equipment and serialization software.
Climate & Sustainability Technologies declined 7% as growth in CO2 systems, global heat exchangers, and beverage can-making were offset by continued weakness in food retail door cases and services.
Dover provided updated guidance for 2025 as well, with the company now expecting adjusted earnings-per-share in a range of $9.50 to $9.60. At the midpoint, this would represent 15.2% growth from 2024.
Click here to download our most recent Sure Analysis report on DOV (preview of page 1 of 3 shown below):
S&P Global (SPGI)
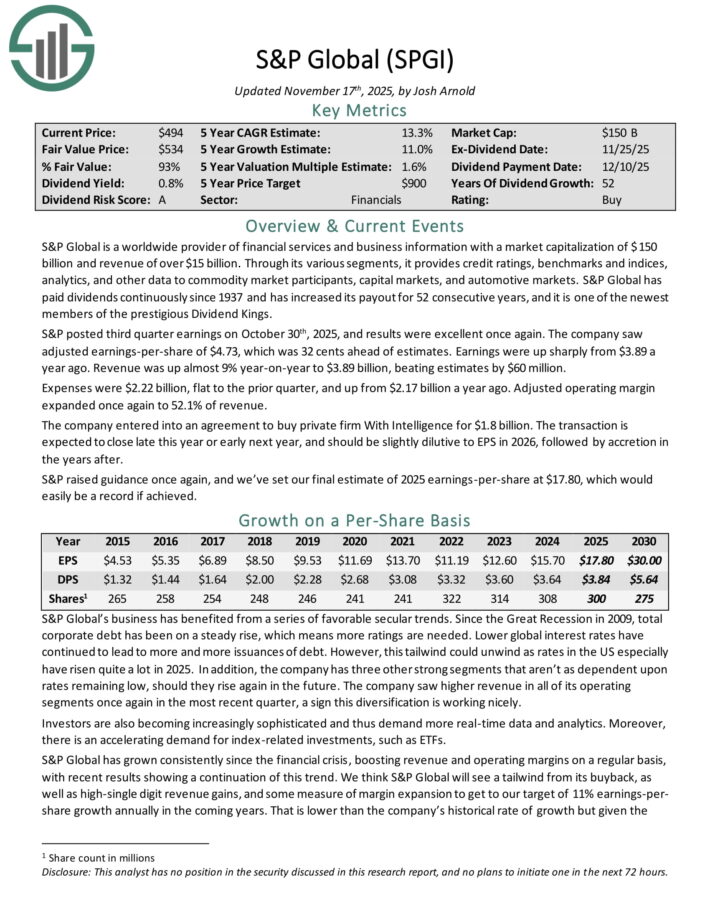
S&P Global is a worldwide provider of financial services and business information with revenue of over $15 billion. Through its various segments, it provides credit ratings, benchmarks and indices, analytics, and other data to commodity market participants, capital markets, and automotive markets.
S&P Global has paid dividends continuously since 1937 and has increased its payout for 52 consecutive years, and it is one of the newest members of the prestigious Dividend Kings.
S&P posted third quarter earnings on October 30th, 2025. The company saw adjusted earnings-per-share of $4.73, which was 32 cents ahead of estimates.
Earnings were up sharply from $3.89 a year ago. Revenue was up almost 9% year-on-year to $3.89 billion, beating estimates by $60 million.
Expenses were $2.22 billion, flat to the prior quarter, and up from $2.17 billion a year ago. Adjusted operating margin expanded once again to 52.1% of revenue.
The company entered into an agreement to buy private firm With Intelligence for $1.8 billion. The transaction is expected to close late this year or early next year, and should be slightly dilutive to EPS in 2026, followed by accretion in the years after.
Click here to download our most recent Sure Analysis report on SPGI (preview of page 1 of 3 shown below):
MSA Safety (MSA)
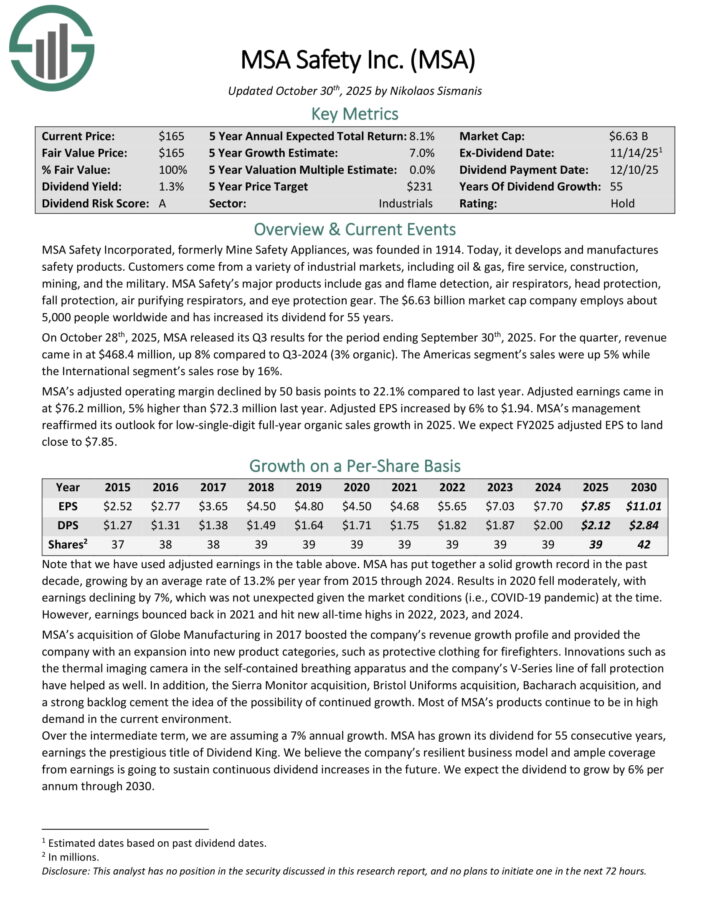
MSA Safety Incorporated, formerly Mine Safety Appliances, was founded in 1914. Today, it develops and manufactures safety products. Customers come from a variety of industrial markets, including oil & gas, fire service, construction, mining, and the military.
MSA Safety’s major products include gas and flame detection, air respirators, head protection, fall protection, air purifying respirators, and eye protection gear. The company employs about 5,000 people worldwide and has increased its dividend for 55 years.
On October 28th, 2025, MSA released its Q3 results. For the quarter, revenue came in at $468.4 million, up 8% compared to Q3-2024 (3% organic). The Americas segment’s sales were up 5% while the International segment’s sales rose by 16%.
MSA’s adjusted operating margin declined by 50 basis points to 22.1% compared to last year. Adjusted earnings came in at $76.2 million, 5% higher than $72.3 million last year. Adjusted EPS increased by 6% to $1.94.
MSA’s management reaffirmed its outlook for low-single-digit full-year organic sales growth in 2025.
Click here to download our most recent Sure Analysis report on MSA (preview of page 1 of 3 shown below):
Walmart Inc. (WMT)
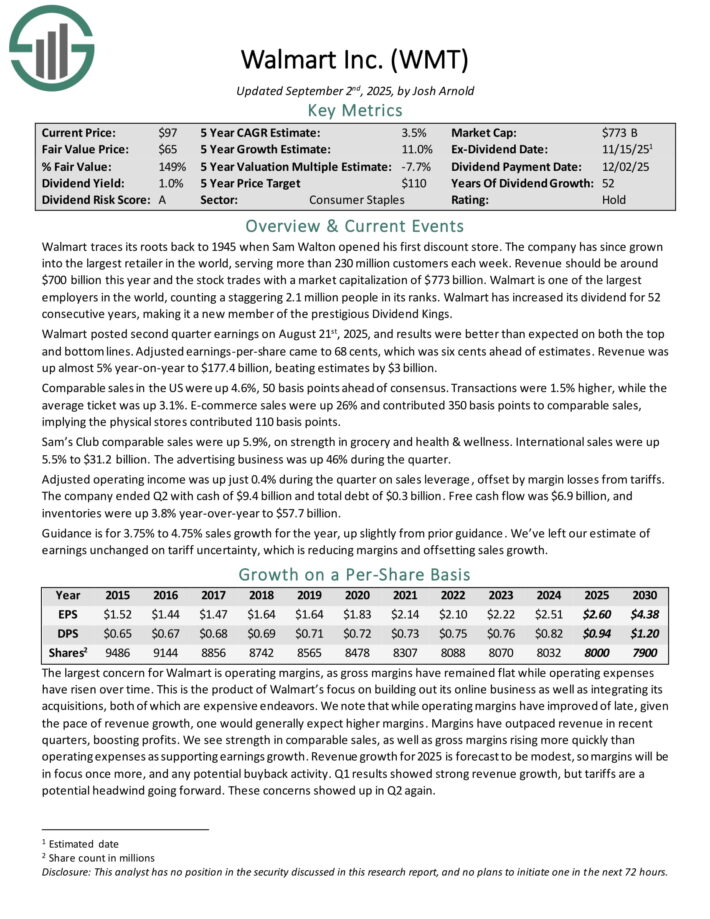
Walmart traces its roots back to 1945 when Sam Walton opened his first discount store. The company has since grown into the largest retailer in the world, serving more than 230 million customers each week. Revenue should be around $700 billion this year.
Walmart posted second quarter earnings on August 21st, 2025, and results were better than expected on both the top and bottom lines. Adjusted earnings-per-share came to 68 cents, which was six cents ahead of estimates. Revenue was up almost 5% year-on-year to $177.4 billion, beating estimates by $3 billion.
Comparable sales in the US were up 4.6%, 50 basis points ahead of consensus. Transactions were 1.5% higher, while the average ticket was up 3.1%. E-commerce sales were up 26% and contributed 350 basis points to comparable sales, implying the physical stores contributed 110 basis points.
Sam’s Club comparable sales were up 5.9%, on strength in grocery and health & wellness. International sales were up 5.5% to $31.2 billion. The advertising business was up 46% during the quarter.
Adjusted operating income was up just 0.4% during the quarter on sales leverage, offset by margin losses from tariffs. The company ended Q2 with cash of $9.4 billion and total debt of $0.3 billion. Free cash flow was $6.9 billion, and inventories were up 3.8% year-over-year to $57.7 billion.
Guidance is for 3.75% to 4.75% sales growth for the year, up slightly from prior guidance.
Click here to download our most recent Sure Analysis report on WMT (preview of page 1 of 3 shown below):
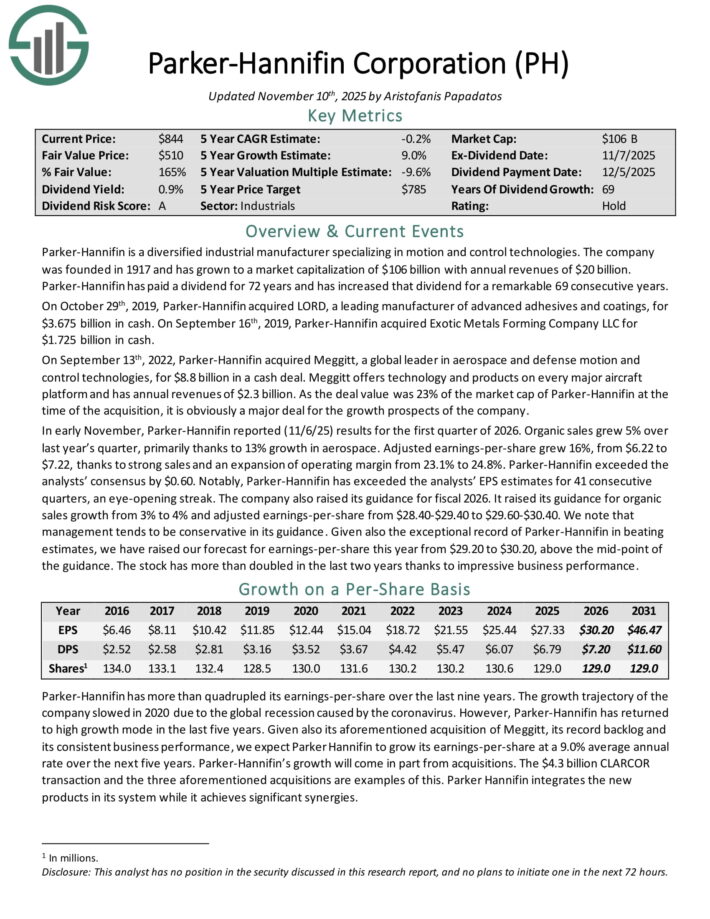
Parker-Hannifin (PH)
Parker-Hannifin is a diversified industrial manufacturer specializing in motion and control technologies. The company generates annual revenues of $20 billion. Parker-Hannifin has increased the dividend for 69 consecutive years.
In early November, Parker-Hannifin reported (11/6/25) results for the first quarter of 2026. Organic sales grew 5% over last year’s quarter, primarily thanks to 13% growth in aerospace.
Adjusted earnings-per-share grew 16%, from $6.22 to $7.22, thanks to strong sales and an expansion of operating margin from 23.1% to 24.8%.
Parker-Hannifin exceeded the analysts’ consensus by $0.60. Notably, Parker-Hannifin has exceeded the analysts’ EPS estimates for 41 consecutive quarters.
The company also raised its guidance for fiscal 2026. It raised its guidance for organic sales growth from 3% to 4% and adjusted earnings-per-share from $28.40-$29.40 to $29.60-$30.40.
Parker-Hannifin has a number of competitive advantages, including its scale, global distribution network, and technical experience.
It manufactures components that are relatively obscure yet critical to the operations of heavy machinery, factory equipment, aircrafts, and other large industrial devices. This is appealing because the company operates in a profitable niche that helps discourage large would-be competitors.
Click here to download our most recent Sure Analysis report on Parker-Hannifin (preview of page 1 of 3 shown below):
Final Thoughts
Investors seeking consistent monthly cash flows can construct a portfolio of high-quality names with long histories of raising dividends.
The stocks created to create this diversified model portfolio yield twice as much as the S&P 500 Index. These names also have at least 25 years of consecutive dividend increases.
Investors can scale this portfolio to meet their needs, and future income will surely increase due to the regular dividend increases that most, if not all, of these companies will provide.
This can provide the investor in retirement with stable cash flows that can be used to meet their needs.
If you are interested in finding more high-quality dividend growth stocks suitable for long-term investment, the following Sure Dividend databases will be useful:
The major domestic stock market indices are another solid resource for finding investment ideas. Sure Dividend compiles the following stock market databases and updates them regularly:
Thanks for reading this article. Please send any feedback, corrections, or questions to [email protected].


")


