

Published on February 4th, 2026 by Bob Ciura
For investors looking for quality dividend stocks to buy, it is not overly difficult finding suitable candidates. All one has to do is look around their home.
Many of the stock market’s best dividend stocks sell things that millions of people have in their homes right now. Such products include food, beverages, household cleaners, and the like.
Collectively, these types of companies are included in the consumer staples sector.
The consumer staples sector is home to some of the most well-known dividend growth stocks in the world.
With that in mind, we’ve compiled a database of more than 60 consumer staples stocks, which you can download below:

Consumer staples stocks are an appealing investment category for a number of reasons.
First of all, consumer staples stocks are very recession-resistant by definition. Consumer staples companies make products or deliver services that are considered to be ‘staples’ – in other words, consumers can’t do without them.
This means that consumer staples stocks tend to hold up very well during periods of economic turmoil. This can be seen by studying the sector’s performance during the 2007-2009 financial crisis.
This article will rank 10 top consumer staples stocks that have market-beating yields of at least 2%.
They also have safe dividends, with our highest Dividend Risk Scores of ‘A’ or ‘B’. And, each has increased its dividend for at least 10 consecutive years.
These 10 consumer staples stocks have strong dividend growth histories, and should be able to raise their dividends for years to come.
Table of Contents
The 10 stocks are ranked by 5-year expected returns, from lowest to highest.
The links below allows for easy navigation:
Household Products Stock #10: Coca-Cola Co. (KO)
Expected Annual Returns: 6.3%
Coca-Cola is one of the largest beverage companies in the world, as it owns or licenses more than 500 unique non-alcoholic brands.
The company has operations in more than 200 countries worldwide. Its products are served about 2 billion times each day, producing annual revenue of close to $48 billion.
Coca-Cola’s portfolio includes 30 brands that generate at least $1 billion in annual revenue.
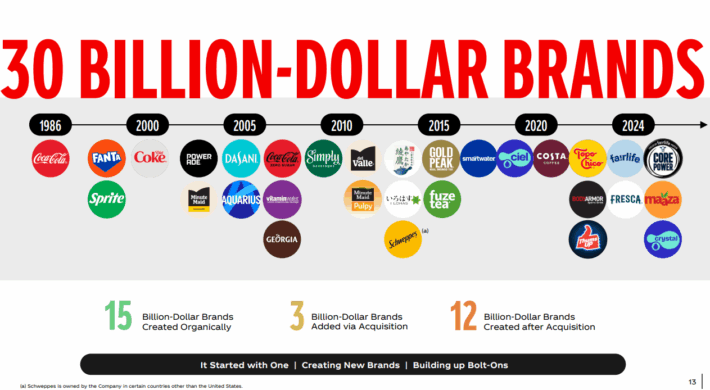
Source: Investor Presentation
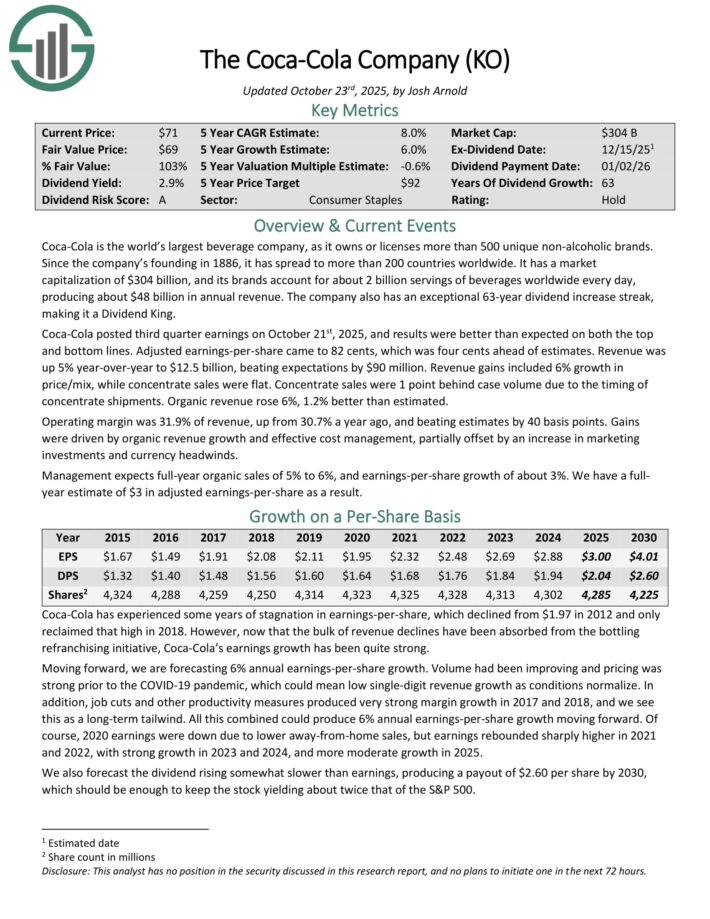
Coca-Cola released third-quarter earnings results on October 21st, 2025, with results that were above estimates on both the top and bottom lines.
Adjusted earnings-per-share of $0.82 was $0.04 better than expected while revenue of $12.5 billion was $90 million more than anticipated.
Revenue gains were supported by a 6% improvement in price/mix while concentrate sales were unchanged. Concentrate sales were 1 point behind case volume due to the timing of concentrate shipments. Organic revenue grew 6%, which was 1.2% better than expected.
The operating margin expanded 120 basis points to 31.9%, which was 40 basis points more than projected. Gains were driven by organic revenue growth and effective cost management, partially offset by an increase in marking investment and currency headwinds.
Click here to download our most recent Sure Analysis report on KO (preview of page 1 of 3 shown below):
Household Products Stock #9: Target Corp. (TGT)
Expected Annual Returns: 6.9%
Target is a major retailer with operations solely in the U.S. market. Its business consists of about 1,850 big box stores, which offer general merchandise and food, as well as serving as distribution points for the company’s burgeoning e-commerce business.
Target should produce more than $100 billion in total revenue this year. The company also sports an extremely impressive dividend increase streak of 57 years.
Target posted third quarter earnings on November 19th, 2025, and results were slightly better than expected. Adjusted earnings-per-share came to $1.78, which was seven cents ahead of estimates.
Revenue was $25.3 billion, meeting expectations, but declining just over 1% year-over-year. Sales were off 1.5% year-over-year, reflecting merchandise sales declines of 1.9%, partially offset by a 17.7% increase in non-merchandise sales.
Comparable sales were off 2.7%, missing estimates for a 2.1% decline. Physical store sales fell 3.8% on a comparable basis, partially offset by digital comparable sales growth of 2.4%.
Operating income was $1.1 billion on an adjusted basis, with gross margin off 10 basis points to 28.2% of revenue. This reflected merchandising pressure from increased markdowns.
Share repurchases were $152 million during the quarter at an average price of $91.59. The company has about $8.3 billion in remaining repurchase capacity under the 2021 authorization that is still incomplete.
Click here to download our most recent Sure Analysis report on TGT (preview of page 1 of 3 shown below):

Household Products Stock #8: Universal Corp. (UVV)
Expected Annual Returns: 7.5%
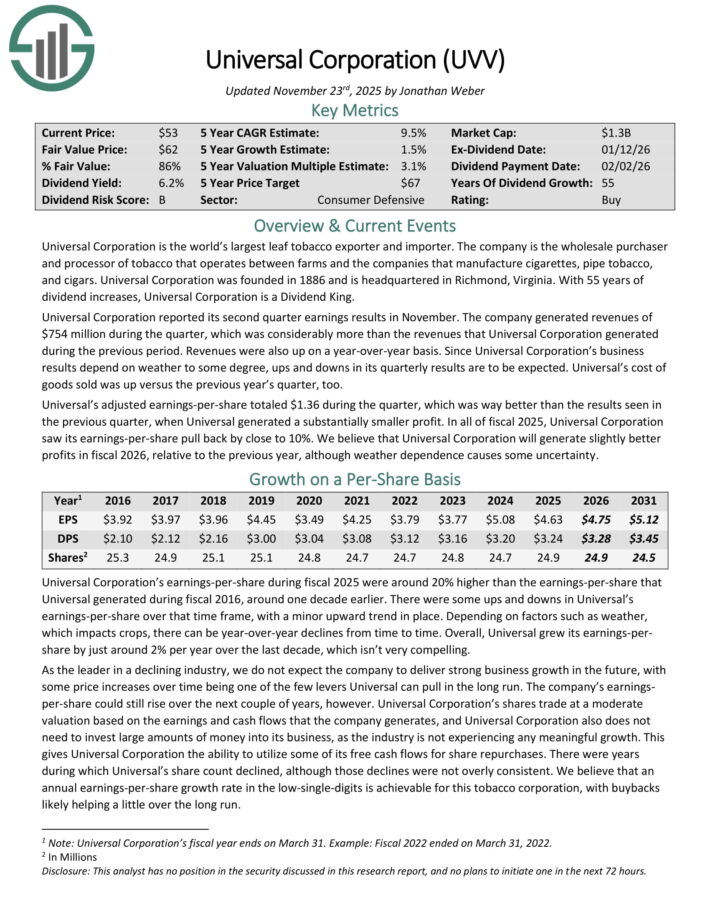
Universal Corporation is the world’s largest leaf tobacco exporter and importer. The company is the wholesale purchaser and processor of tobacco that operates between farms and the companies that manufacture cigarettes, pipe tobacco, and cigars.
Universal Corporation was founded in 1886 and is headquartered in Richmond, Virginia. With 55 years of dividend increases, Universal Corporation is a Dividend King.
Universal Corporation reported its second quarter earnings results in November. The company generated revenue of $754 million during the quarter, which was considerably more than the revenues that Universal Corporation generated during the previous period.
Revenues were also up on a year-over-year basis. Since Universal Corporation’s business results depend on weather to some degree, ups and downs in its quarterly results are to be expected. Universal’s cost of goods sold was up versus the previous year’s quarter.
Universal’s adjusted earnings-per-share totaled $1.36 during the quarter. In fiscal 2025, Universal Corporation saw its earnings-per-share pull back by close to 10%.
Click here to download our most recent Sure Analysis report on UVV (preview of page 1 of 3 shown below):
Household Products Stock #7: The Marzetti Company (MZTI)
Expected Annual Returns: 9.3%
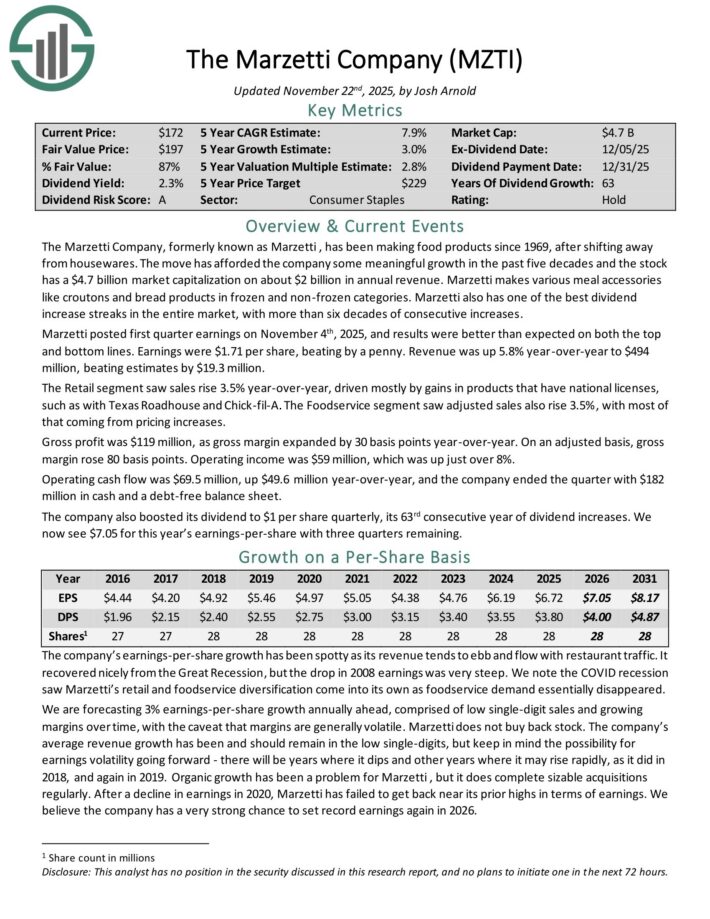
The Marzetti Company has been making food products since 1969, after shifting away from housewares. Marzetti makes various meal accessories like croutons and bread products in frozen and non-frozen categories.
It also has one of the best dividend increase streaks in the entire market, with more than six decades of consecutive increases.
Marzetti posted first quarter earnings on November 4th, 2025, and results were better than expected on both the top and bottom lines.
Earnings were $1.71 per share, beating by a penny. Revenue was up 5.8% year-over-year to $494 million, beating estimates by $19.3 million.
Retail segment sales rose 3.5% year-over-year, driven mostly by gains in products that have national licenses, such as with Texas Roadhouse and Chick-fil-A.
The Foodservice segment saw adjusted sales also rise 3.5%, with most of that coming from pricing increases.
Gross profit was $119 million, as gross margin expanded by 30 basis points year-over-year. On an adjusted basis, gross margin rose 80 basis points. Operating income was $59 million, which was up just over 8%.
Operating cash flow was $69.5 million, up $49.6 million year-over-year, and the company ended the quarter with $182 million in cash and a debt-free balance sheet.
The company also boosted its dividend to $1 per share quarterly, its 63rd consecutive year of dividend increases.
Click here to download our most recent Sure Analysis report on MZTI (preview of page 1 of 3 shown below):
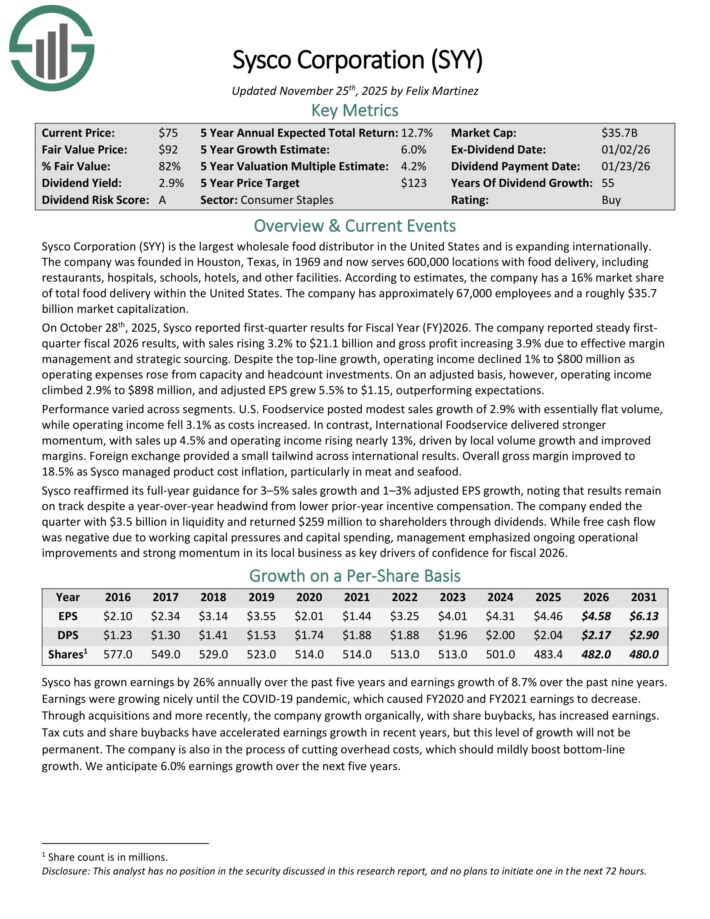
Household Products Stock #6: Sysco Corp. (SYY)
Expected Annual Returns: 10.0%
Sysco Corporation is the largest wholesale food distributor in the United States and is expanding internationally. The company serves 600,000 locations with food delivery, including restaurants, hospitals, schools, hotels, and other facilities.
According to estimates, the company has a 16% market share of total food delivery within the United States. The company has approximately 67,000 employees.
On October 28th, 2025, Sysco reported first-quarter results for Fiscal Year 2026. The company reported steady first-quarter fiscal 2026 results, with sales rising 3.2% to $21.1 billion and gross profit increasing 3.9% due to effective margin management and strategic sourcing.
Despite the top-line growth, operating income declined 1% to $800 million as operating expenses rose from capacity and headcount investments. On an adjusted basis, however, operating income climbed 2.9% to $898 million, and adjusted EPS grew 5.5% to $1.15, outperforming expectations.
Sysco reaffirmed its full-year guidance for 3–5% sales growth and 1–3% adjusted EPS growth, noting that results remain on track despite a year-over-year headwind from lower prior-year incentive compensation.
Click here to download our most recent Sure Analysis report on SYY (preview of page 1 of 3 shown below):
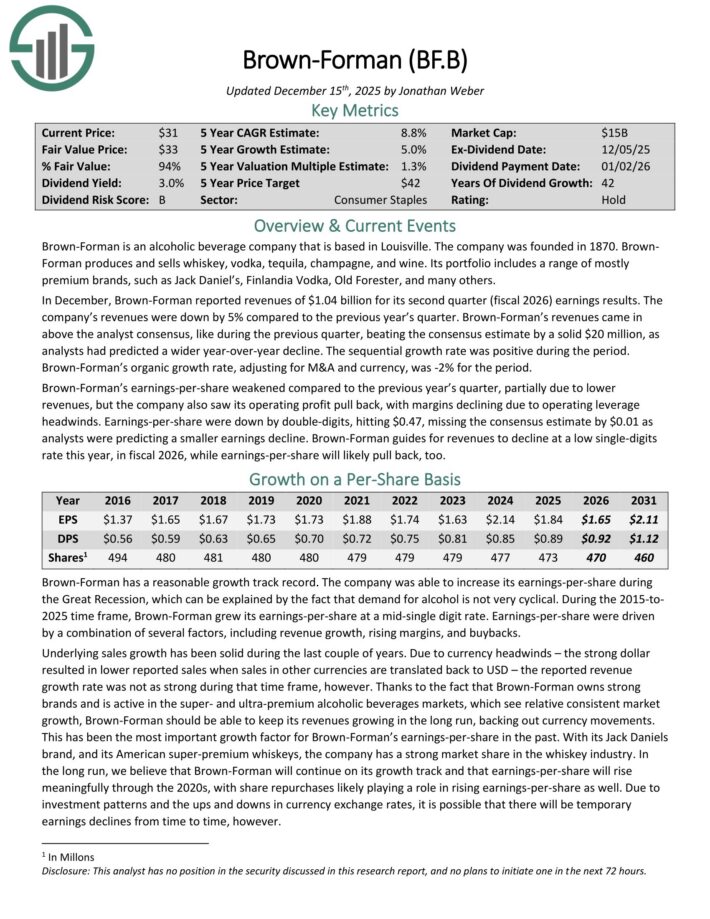
Household Products Stock #5: Brown-Forman Corp. (BF.B)
Expected Annual Returns: 11.2%
Brown-Forman is an alcoholic beverage company based in Louisville. It produces and sells whiskey, vodka, tequila, champagne, and wine.
Its portfolio includes a range of mostly premium brands, such as Jack Daniel’s, Finlandia Vodka, Old Forester, and many others.
In December, Brown-Forman reported revenues of $1.04 billion for its second quarter (fiscal 2026) earnings results. Revenue declined by 5% compared to the previous year’s quarter. Revenue came in above the analyst consensus by $20 million.
Organic growth, adjusting for M&A and currency, was -2% for the period. Earnings-per-share weakened compared to the previous year’s quarter, partially due to lower revenues, but the company also saw its operating profit pull back, with margins declining due to operating leverage headwinds.
Earnings-per-share were down by double-digits at $0.47, missing the consensus estimate by $0.01. Brown-Forman guides for revenues to decline at a low single-digit rate in fiscal 2026.
Brown-Forman has increased its dividend for 42 consecutive years.
Click here to download our most recent Sure Analysis report on BF.B (preview of page 1 of 3 shown below):
Household Products Stock #4: Hormel Foods Corp. (HRL)
Expected Annual Returns: 11.4%
Hormel Foods was founded in 1891 in Minnesota. Since that time, the company has grown into a food products giant with about $12 billion in annual revenue.
The company sells its products in 80 countries worldwide, and its brands include Skippy, SPAM, Applegate, Justin’s, and more than 30 others.
In addition, Hormel is a member of the Dividend Kings, having increased its dividend for 60 consecutive years.
Hormel posted fourth quarter and full-year earnings on December 4th, 2025.
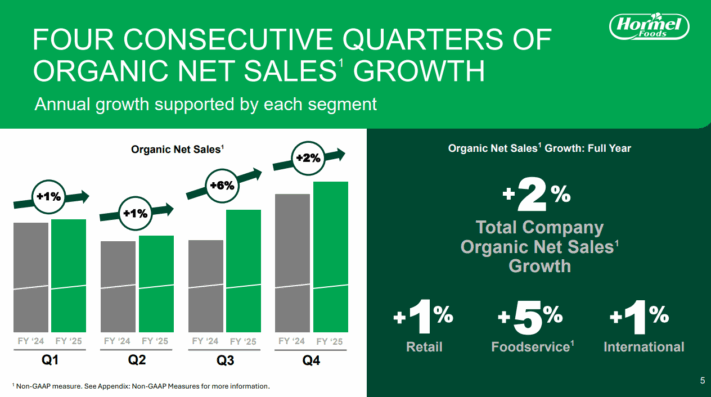
Source: Investor Presentation
The company saw 32 cents in adjusted earnings-per-share for the quarter, beating estimates by two cents. Revenue was up 1.6% year-over-year and missed estimates by $30 million, coming in at $3.19 billion.
Adjusted operating margin was 7.7% of revenue, while cash flow from operations was $323 million. Volumes in the fourth quarter were flat in the retail segment, down 5% in foodservice, and down 7% in the international segment.
Hormel raised its dividend for the 60th consecutive year, this time adding 0.9% to a new payout of $1.20 per share annually. We start 2026 with an estimate of $1.47 in adjusted earnings-per-share.
Click here to download our most recent Sure Analysis report on HRL (preview of page 1 of 3 shown below):

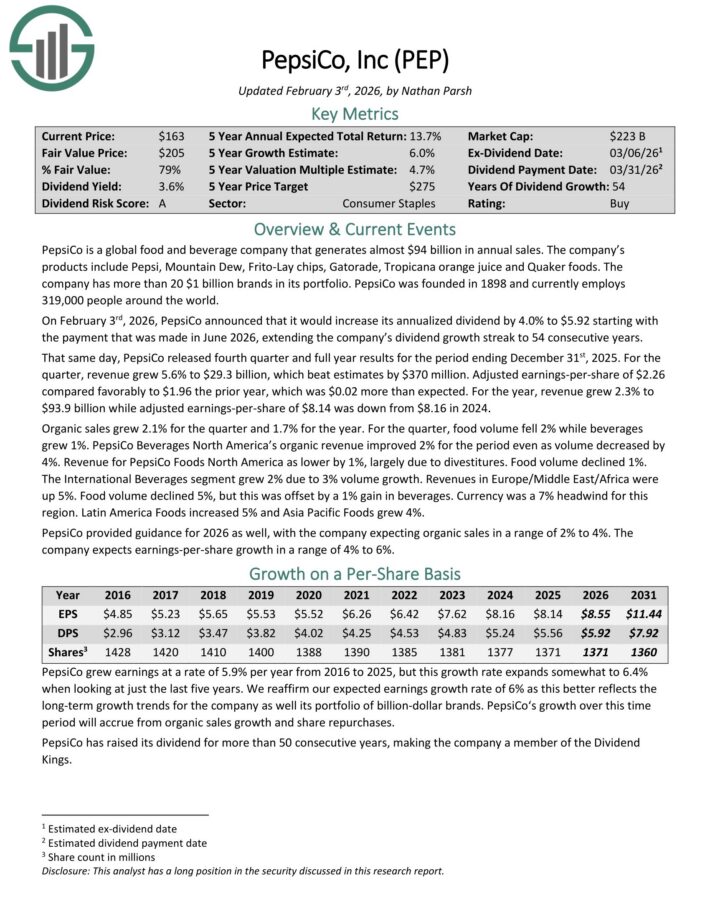
Household Products Stock #3: PepsiCo Inc. (PEP))
Expected Annual Returns: 12.7%
PepsiCo is a global food and beverage company that generates almost $94 billion in annual sales. The company’s products include Pepsi, Mountain Dew, Frito-Lay chips, Gatorade, Tropicana orange juice and Quaker foods.
The company has more than 20 $1 billion brands in its portfolio.
On February 3rd, 2026, PepsiCo announced that it would increase its annualized dividend by 4.0% to $5.92 starting with the payment that was made in June 2026, extending the company’s dividend growth streak to 54 consecutive years.
That same day, PepsiCo released fourth quarter and full year results for the period ending December 31st, 2025. For the quarter, revenue grew 5.6% to $29.3 billion, which beat estimates by $370 million.
Adjusted earnings-per-share of $2.26 compared favorably to $1.96 the prior year, which was $0.02 more than expected.
For the year, revenue grew 2.3% to $93.9 billion while adjusted earnings-per-share of $8.14 was down from $8.16 in 2024. Organic sales grew 2.1% for the quarter and 1.7% for the year.
For the quarter, food volume fell 2% while beverages grew 1%. PepsiCo Beverages North America’s organic revenue improved 2% for the period even as volume decreased by 4%.
Revenue for PepsiCo Foods North America as lower by 1%, largely due to divestitures. Food volume declined 1%.
The International Beverages segment grew 2% due to 3% volume growth. Revenues in Europe/Middle East/Africa were up 5%. Food volume declined 5%, but this was offset by a 1% gain in beverages.
Currency was a 7% headwind for this region. Latin America Foods increased 5% and Asia Pacific Foods grew 4%.
PepsiCo provided guidance for 2026 as well, with the company expecting organic sales in a range of 2% to 4%. The company expects earnings-per-share growth in a range of 4% to 6%.
Click here to download our most recent Sure Analysis report on PEP (preview of page 1 of 3 shown below):
Household Products Stock #2: Kimberly-Clark Corp. (KMB)
Expected Annual Returns: 13.0%
The Kimberly-Clark Corporation is a global consumer products company that operates in 175 countries and sells disposable consumer goods, including paper towels, diapers, and tissues.
It operates through two segments that each house many popular brands: Personal Care Segment (Huggies, Pull-Ups, Kotex, Depend, Poise) and the Consumer Tissue segment (Kleenex, Scott, Cottonelle, and Viva), generating about $20 billion in annual revenue.
Kimberly-Clark posted third quarter earnings on October 30th, 2025, and results were better than expected on both the top and bottom lines.
Adjusted earnings-per-share came to $1.82, which was seven cents ahead of estimates. Revenue was flat year-over-year at $4.15 billion, but did best estimates by $50 million.
Sales included negative impacts of about 2.2% from the exit of the private label diaper business in the US. Organic sales were up 2.5%, which was driven by a 2.4% gain in volume, while portfolio mix and price were flat.
Gross margin was 36.8% of revenue on an adjusted basis, off 170 basis points year-over-year. This reflected strong productivity gains that were more than offset by unfavorable pricing net of cost inflation.
Operating profit was $683 million on an adjusted basis, driven by lower marketing and R&D costs, as well as efficiency efforts. Net interest expense was $59 million, up from $49 million a year ago.
We now see $7.50 in adjusted earnings-per-share for this year, which would be the highest since 2020, if achieved. Separately, Kimberly-Clark announced its intention to buy Kenvue (KVUE) for $48.7 billion in a cash and stock deal.
Click here to download our most recent Sure Analysis report on KMB (preview of page 1 of 3 shown below):

Household Products Stock #1: McCormick & Co. (MKC)
Expected Annual Returns: 13.5%
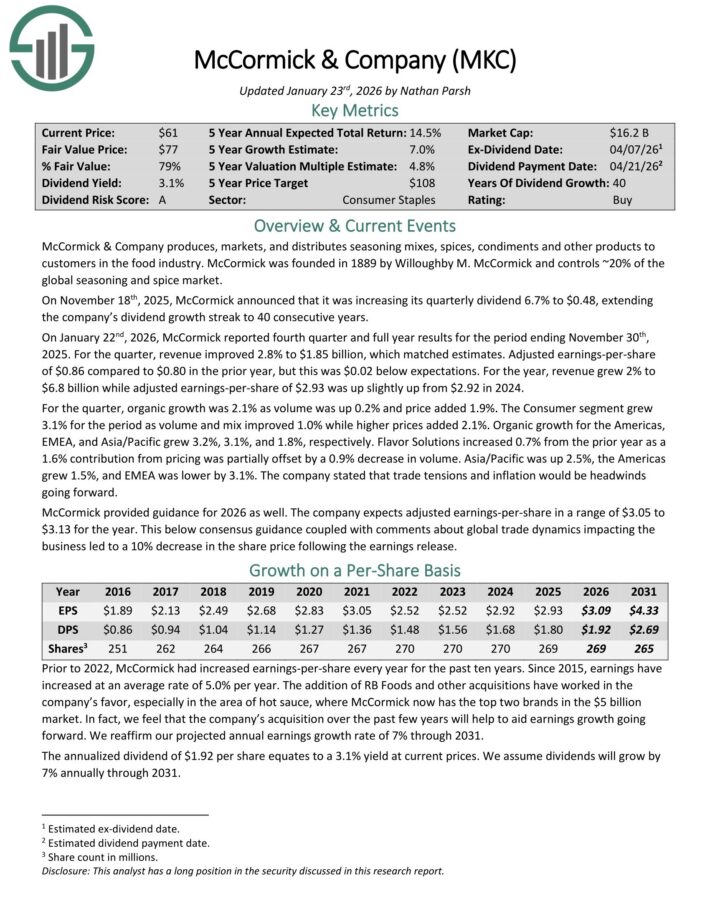
McCormick & Company produces, markets, and distributes seasoning mixes, spices, condiments and other products to customers in the food industry. It controls ~20% of the global seasoning and spice market.
On November 18th, 2025, McCormick announced that it was increasing its quarterly dividend 6.7% to $0.48, extending the company’s dividend growth streak to 40 consecutive years.
On January 22nd, 2026, McCormick reported fourth quarter and full year results for the period ending November 30th, 2025. For the quarter, revenue improved 2.8% to $1.85 billion, which matched estimates.
Adjusted earnings-per-share of $0.86 compared to $0.80 in the prior year, but this was $0.02 below expectations.
For the year, revenue grew 2% to $6.8 billion while adjusted earnings-per-share of $2.93 was up slightly up from $2.92 in 2024.
For the quarter, organic growth was 2.1% as volume was up 0.2% and price added 1.9%. The Consumer segment grew 3.1% for the period as volume and mix improved 1.0% while higher prices added 2.1%.
Organic growth for the Americas, EMEA, and Asia/Pacific grew 3.2%, 3.1%, and 1.8%, respectively. Flavor Solutions increased 0.7% from the prior year as a 1.6% contribution from pricing was partially offset by a 0.9% decrease in volume.
Asia/Pacific was up 2.5%, the Americas grew 1.5%, and EMEA was lower by 3.1%. The company stated that trade tensions and inflation would be headwinds going forward.
McCormick provided guidance for 2026 as well. The company expects adjusted earnings-per-share in a range of $3.05 to $3.13 for the year.
Click here to download our most recent Sure Analysis report on MKC (preview of page 1 of 3 shown below):
Additional Resources
If you’re willing to look outside of this sector while hunting for investment opportunities, the following stock databases are highly useful:
Thanks for reading this article. Please send any feedback, corrections, or questions to [email protected].


 (CATO) Q4 2025 Earnings Results")


 To Build A Durable Pipeline Of Good-Fit Prospects: #FASuccess Ep 480 With Helen Stephens")


