


Dogecoin is pressing on a familiar technical hinge on the weekly chart. In a setup highlighted by crypto analyst Cantonese Cat (@cantonmeow), DOGE has completed a third multi-month descending trendline test in as many cycles, with price now hovering just below a quarter dollar after a brief breakout and early retest.
On the 1-week timeframe, the chart shows three distinct bear-market trendlines and subsequent expansions. The first downtrend, drawn from late-2022 swing highs through mid-2023 lower highs, was broken in September 2023. From that breakout point, DOGE advanced roughly 230%, marking the cycle’s initial expansion phase.
The second sequence repeated across late-2023 into 2024: an April–June 2024 distribution created a fresh descending line that capped price through October 2024, when a weekly close through the line triggered the next impulse. From that October 2024 breakout, the advance extended about 350% into the late-2024 peak.
Related Reading
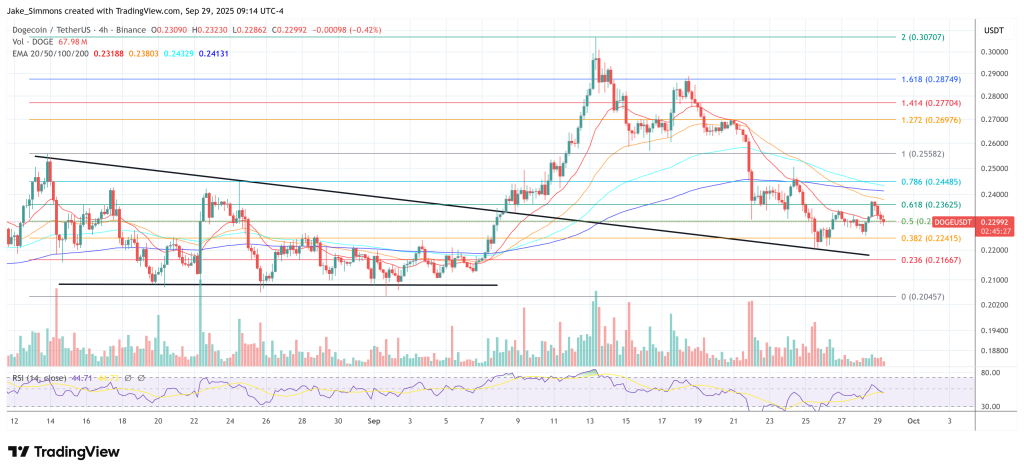
Price action since the November–December 2024 high near $0.48 carved the third descending trendline. Over the past several candles, DOGE pushed through that line, then slipped back toward it, producing a classic “return move” on reduced momentum. As of the chart’s timestamp (Sep. 29, 2025, 00:04 UTC), DOGE trades around $0.2369 on the weekly, a level that sits in the middle of this retest zone.
Golden Cross Or One More Dip For Dogecoin?
Crypto analyst Cas Abbé (@cas_abbe) is closely monitoring the daily chart, where a golden cross between the 100-day SMA ($0.2192) and the 200-day EMA ($0.2199) is forming. Historically, such crossovers have signaled the beginning of extended bullish phases.
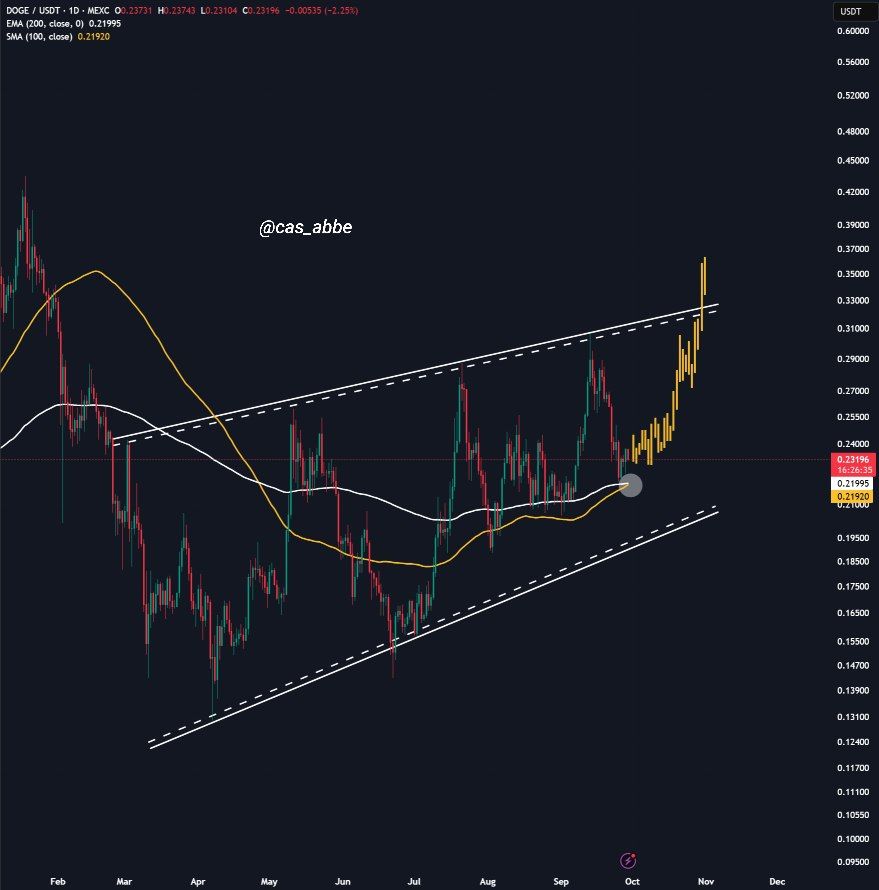
Abbé stressed the broader market impact of a Dogecoin rally, noting: “DOGE golden cross is approaching soon. This is one of the alts I’m paying very close attention to. The reason is very simple: When DOGE pumps, Altseason starts.” His key threshold is $0.33, a resistance level that has capped multiple rallies. A clean break above it could accelerate capital rotation into the broader altcoin market. “If DOGE manages to pump above $0.33, alts will go bonkers,” he noted.
Related Reading
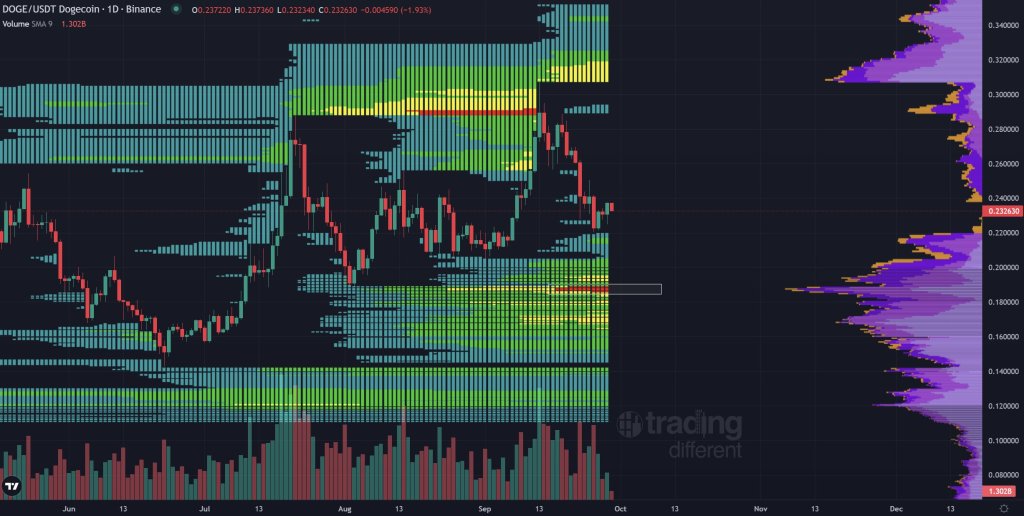
Meanwhile, liquidity dynamics add nuance to the technical picture. Cryptoinsightuk (@Cryptoinsightuk) shared a liquidity heatmap indicating dense bids around $0.18, while supply concentrations above $0.30 form notable resistance zones. He explained his tactical approach: “Because of this I’ve closed my DOGE long slightly in the green and I’ve placed bids around $0.18.” This reflects a market structure where traders are positioning for downside liquidity sweeps before potential continuation higher.
Currently trading near $0.229, DOGE sits at the intersection of conflicting signals. On one side, the historical pattern of breakouts from descending trendlines, the imminent golden cross, and Abbé’s $0.33 breakout level argue for bullish continuation. On the other, liquidity maps suggest vulnerability to deeper retracements toward $0.20–0.18 before any sustained rally.
Featured image created with DALL.E, chart from TradingView.com


