

Published on February 9th, 2026 by Bob Ciura
Monthly dividend stocks have instant appeal for many income investors.
Stocks that pay their dividends each month offer more frequent payouts than traditional quarterly or semi-annual dividend payers.
For this reason, we created a full list of over 100 monthly dividend stocks.
You can download our full Excel spreadsheet of all monthly dividend stocks (along with metrics that matter like dividend yield and payout ratio) by clicking on the link below:

But while monthly dividend stocks are attractive on the surface, not all can sustain their payouts. Income investors should try to avoid dividend cuts or elimination as much as possible.
This article will discuss 10 red flag monthly dividend stocks that could be susceptible to a dividend cut in the future, particularly in a recession.
The 10 stocks in this article all have Dividend Risk Scores of ‘D’ or ‘F’ (our lowest grades) in the Sure Analysis Research Database, with payout ratios above 100%.
A payout ratio above 100% indicates the company is not generating enough underlying earnings to sustain the dividend payout. This leaves a high likelihood of a dividend cut or elimination at some point in the future.
The list is sorted by dividend payout ratio, from lowest to highest.
Table Of Contents
Stocks are listed by their dividend yields, from lowest to highest.
You can instantly jump to an individual section of the article by utilizing the links below:
Red Flag Monthly Dividend Stock #10: Gladstone Investment Corporation (GAIN)
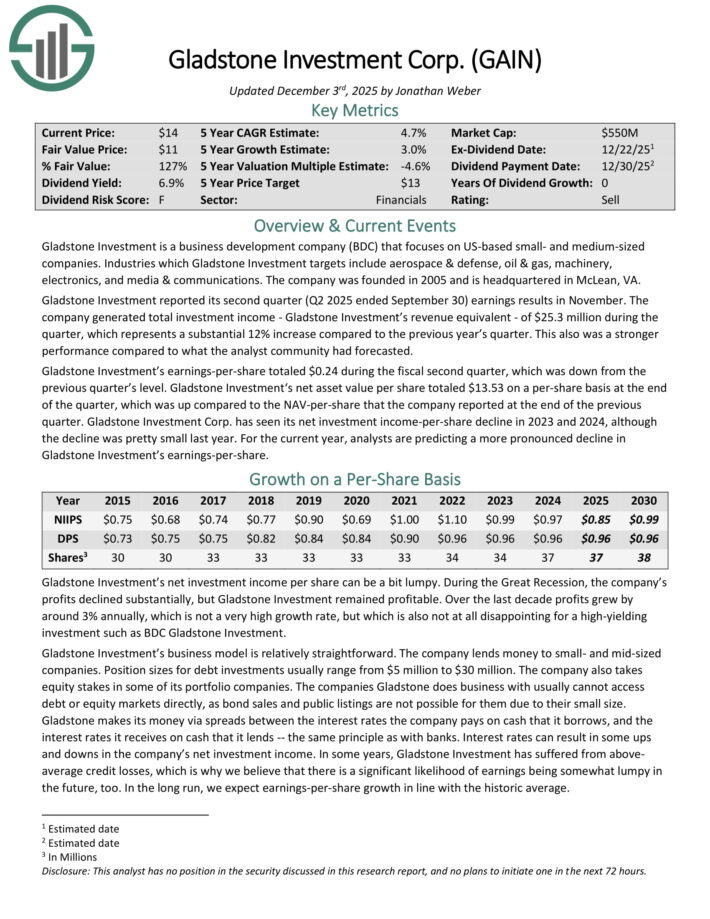
Gladstone Investment is a business development company (BDC) that focuses on US-based small- and medium-sized companies.
Industries which Gladstone Investment targets include aerospace & defense, oil & gas, machinery, electronics, and media & communications. The company was founded in 2005 and is headquartered in McLean, VA.
Gladstone Investment reported its second quarter (Q2 2025 ended September 30) earnings results in November. The company generated total investment income of $25.3 million during the quarter, which represented a 12% increase year-over-year.
Gladstone Investment’s earnings-per-share totaled $0.24 during the fiscal second quarter, which was down from the previous quarter’s level.
Gladstone Investment‘s net asset value per share totaled $13.53 on a per-share basis at the end of the quarter, which was up compared to the NAV-per-share that the company reported at the end of the previous quarter.
Click here to download our most recent Sure Analysis report on GAIN (preview of page 1 of 3 shown below):
Red Flag Monthly Dividend Stock #9: Horizon Technology Finance Corp. (HRZN)
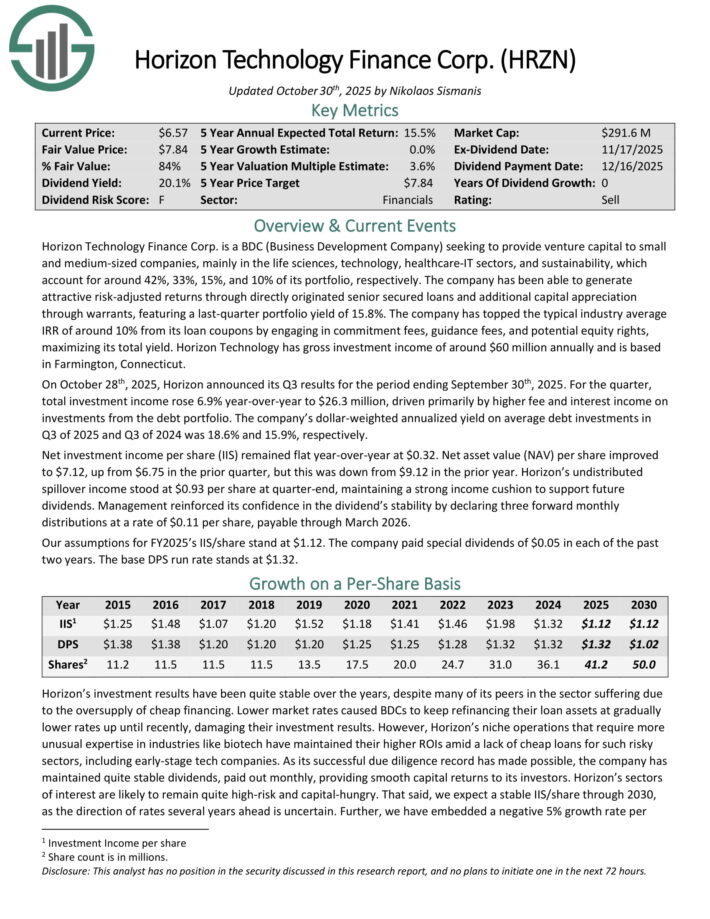
Horizon Technology Finance Corp. is a BDC that provides venture capital to small and medium–sized companies in the technology, life sciences, and healthcare–IT sectors.
The company has generated attractive risk–adjusted returns through directly originated senior secured loans and additional capital appreciation through warrants.
Horizon Technology Finance Corp. is a BDC that provides venture capital to small and medium–sized companies in the technology, life sciences, and healthcare–IT sectors.
On October 28th, 2025, Horizon announced its Q3 results. For the quarter, total investment income rose 6.9% year-over-year to $26.3 million, driven primarily by higher fee and interest income on investments from the debt portfolio.
The company’s dollar-weighted annualized yield on average debt investments in Q3 of 2025 and Q3 of 2024 was 18.6% and 15.9%, respectively.
Net investment income per share (IIS) remained flat year-over-year at $0.32. Net asset value (NAV) per share improved to $7.12, up from $6.75 in the prior quarter, but this was down from $9.12 in the prior year.
Horizon’s undistributed spillover income stood at $0.93 per share at quarter-end, maintaining a strong income cushion to support future dividends.
Click here to download our most recent Sure Analysis report on HRZN (preview of page 1 of 3 shown below):
Red Flag Monthly Dividend Stock #8: Stellus Capital (SCM)
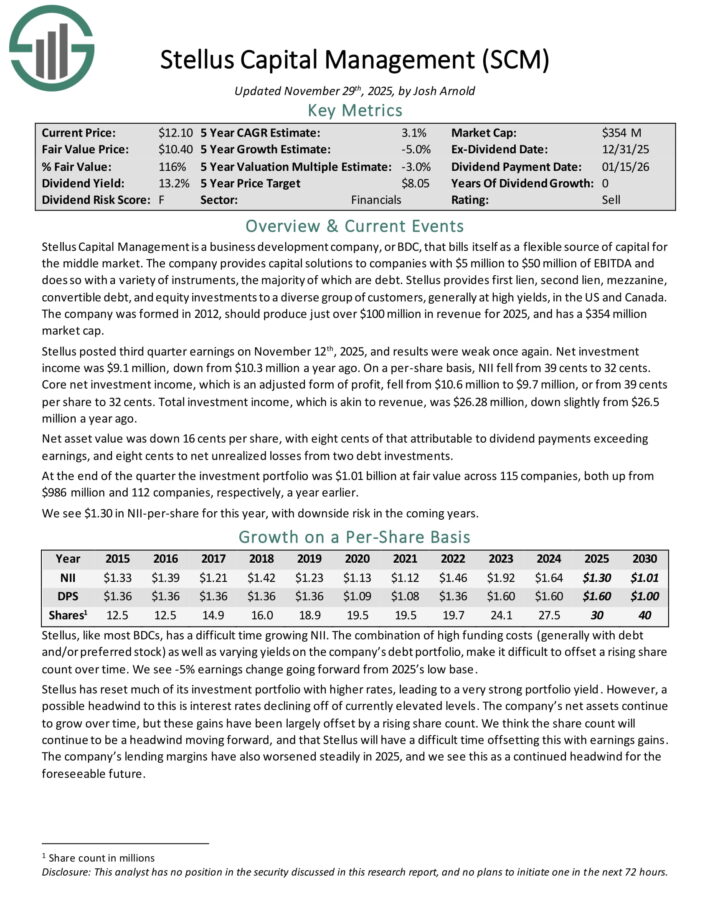
Stellus Capital Management provides capital solutions to companies with $5 million to $50 million of EBITDA and does so with a variety of instruments, the majority of which are debt.
Stellus provides first lien, second lien, mezzanine, convertible debt, and equity investments to a diverse group of customers, generally at high yields, in the US and Canada.
Stellus posted third quarter earnings on November 12th, 2025, and results were weak once again. Net investment income was $9.1 million, down from $10.3 million a year ago. On a per-share basis, NII fell from 39 cents to 32 cents.
Core net investment income, which is an adjusted form of profit, fell from $10.6 million to $9.7 million, or from 39 cents per share to 32 cents. Total investment income, which is akin to revenue, was $26.28 million, down slightly from $26.5 million a year ago.
Net asset value was down 16 cents per share, with eight cents of that attributable to dividend payments exceeding earnings, and eight cents to net unrealized losses from two debt investments.
At the end of the quarter the investment portfolio was $1.01 billion at fair value across 115 companies, both up from $986 million and 112 companies, respectively, a year earlier.
Click here to download our most recent Sure Analysis report on SCM (preview of page 1 of 3 shown below):
Red Flag Monthly Dividend Stock #7: Freehold Royalties Ltd. (FRHLF)
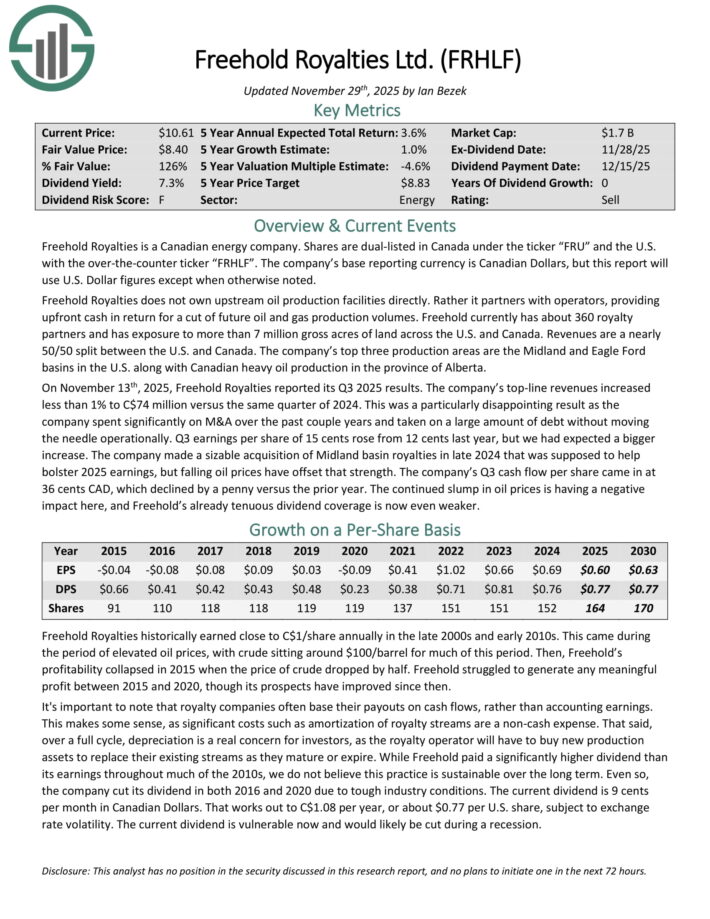
Freehold Royalties is a Canadian energy company. It does not own upstream oil production facilities directly. Rather it partners with operators, providing upfront cash in return for a cut of future oil and gas production volumes.
Freehold currently has about 360 royalty partners and has exposure to more than 7 million gross acres of land across the U.S. and Canada. Revenues are a nearly 50/50 split between the U.S. and Canada.
The company’s top three production areas are the Midland and Eagle Ford basins in the U.S. along with Canadian heavy oil production in the province of Alberta.
On November 13th, 2025, Freehold Royalties reported its Q3 2025 results. The company’s top-line revenues increased less than 1% to C$74 million versus the same quarter of 2024.
This was a particularly disappointing result as the company spent significantly on M&A over the past couple years and taken on a large amount of debt without moving the needle operationally. Earnings per share of 15 cents rose from 12 cents last year, but we had expected a bigger increase.
The company made a sizable acquisition of Midland basin royalties in late 2024 that was supposed to help bolster 2025 earnings, but falling oil prices have offset that strength.
Cash flow per share came in at 36 cents CAD, which declined by a penny versus the prior year.
Click here to download our most recent Sure Analysis report on FRHLF (preview of page 1 of 3 shown below):
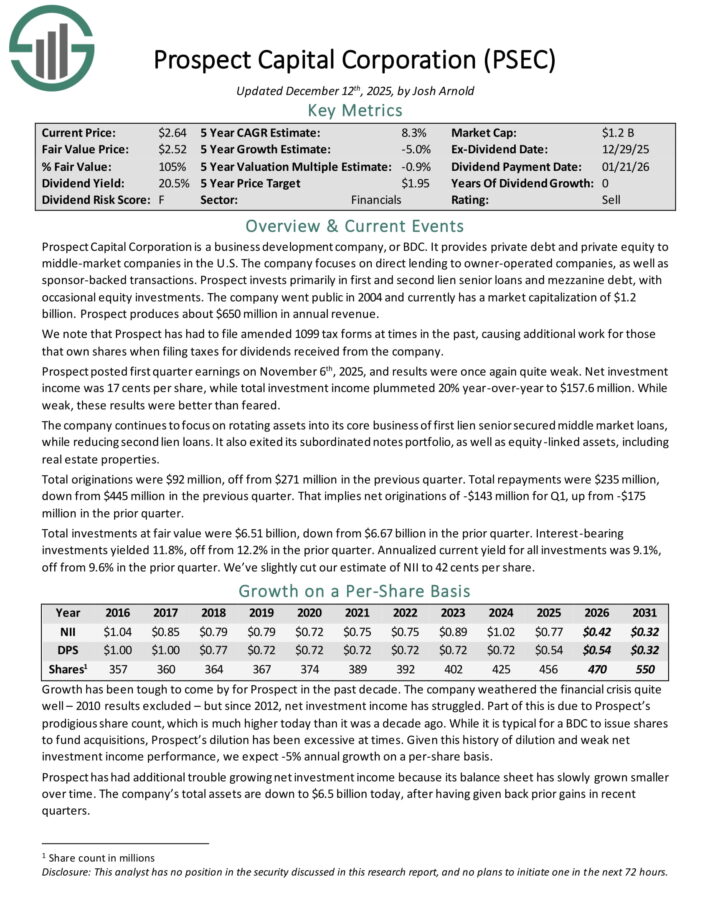
Red Flag Monthly Dividend Stock #6: Prospect Capital (PSEC)
Prospect Capital Corporation is a Business Development Company, or BDC, that provides private debt and private equity to middle–market companies in the U.S.
The company focuses on direct lending to owner–operated companies, as well as sponsor–backed transactions. Prospect invests primarily in first and second lien senior loans and mezzanine debt, with occasional equity investments.
Prospect posted first quarter earnings on November 6th, 2025. Net investment income was 17 cents per share, while total investment income plummeted 20% year-over-year to $157.6 million. While weak, these results were better than feared.
The company continues to focus on rotating assets into its core business of first lien senior secured middle market loans, while reducing second lien loans. It also exited its subordinated notes portfolio, as well as equity-linked assets, including real estate properties.
Total originations were $92 million, off from $271 million in the previous quarter. Total repayments were $235 million, down from $445 million in the previous quarter. That implies net originations of -$143 million for Q1, up from -$175 million in the prior quarter.
Total investments at fair value were $6.51 billion, down from $6.67 billion in the prior quarter. Interest-bearing investments yielded 11.8%, off from 12.2% in the prior quarter.
Click here to download our most recent Sure Analysis report on PSEC (preview of page 1 of 3 shown below):
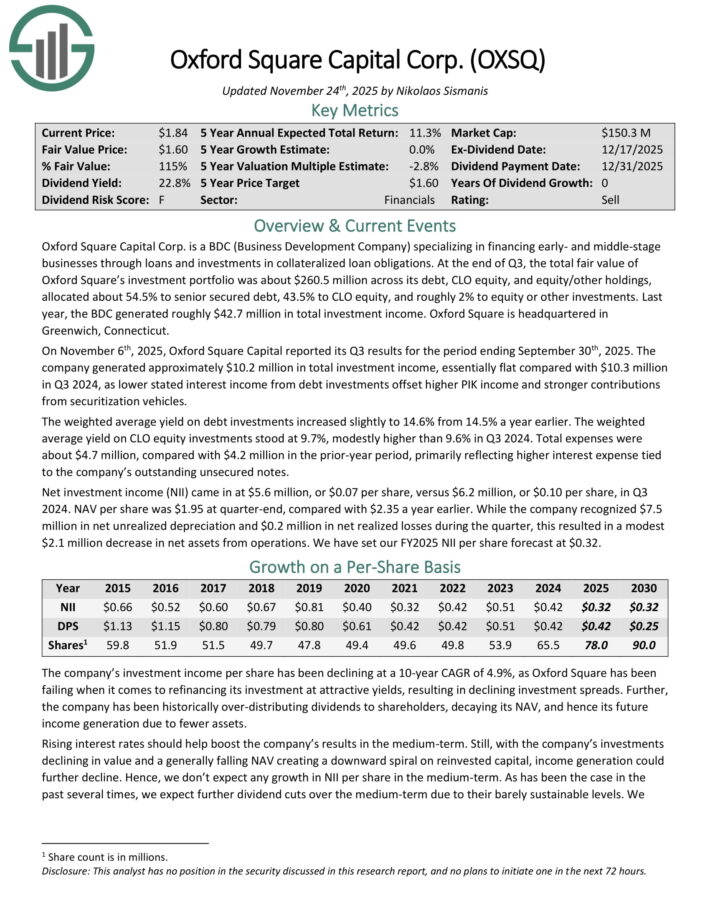
Red Flag Monthly Dividend Stock #5: Oxford Square Capital (OXSQ)
Oxford Square Capital Corp. is a BDC (Business Development Company) specializing in financing early- and middle-stage businesses through loans and investments in collateralized loan obligations.
At the end of Q3, the total fair value of Oxford Square’s investment portfolio was about $260.5 million across its debt, CLO equity, and equity/other holdings, allocated about 54.5% to senior secured debt, 43.5% to CLO equity, and roughly 2% to equity or other investments. Last year, the BDC generated roughly $42.7 million in total investment income.
On November 6th, 2025, Oxford Square Capital reported its Q3. The company generated approximately $10.2 million in total investment income, essentially flat compared with $10.3 million in Q3 2024, as lower stated interest income from debt investments offset higher PIK income and stronger contributions from securitization vehicles.
The weighted average yield on debt investments increased slightly to 14.6% from 14.5% a year earlier. The weighted average yield on CLO equity investments stood at 9.7%, modestly higher than 9.6% in Q3 2024.
Total expenses were about $4.7 million, compared with $4.2 million in the prior-year period, primarily reflecting higher interest expense tied to the company’s outstanding unsecured notes.
Net investment income (NII) came in at $5.6 million, or $0.07 per share, versus $6.2 million, or $0.10 per share, in Q3 2024.
Click here to download our most recent Sure Analysis report on OXSQ (preview of page 1 of 3 shown below):
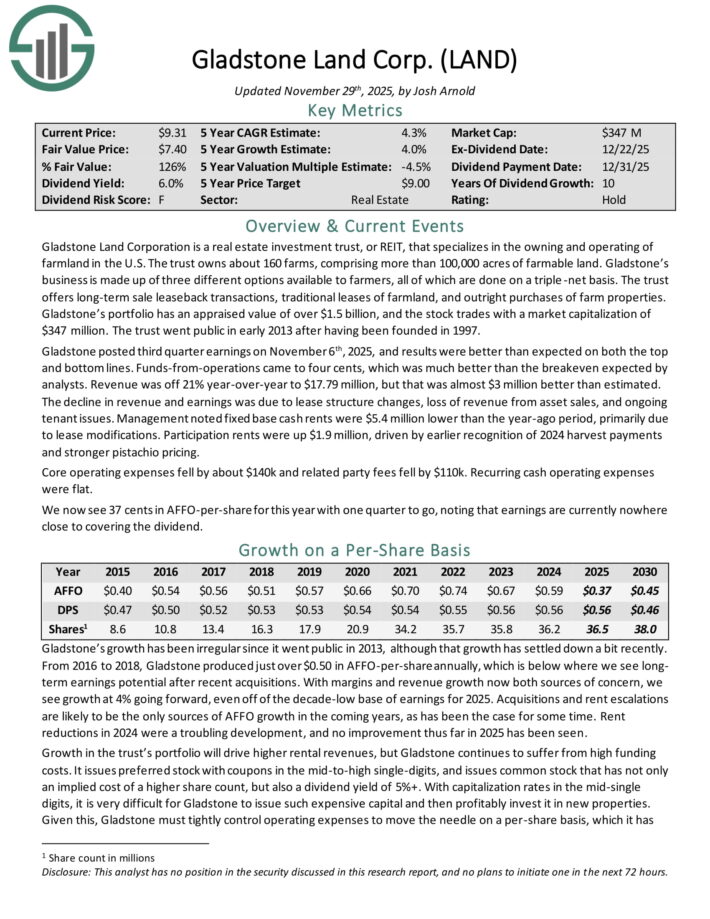
Red Flag Monthly Dividend Stock #4: Gladstone Land Corp. (LAND)
Gladstone Land Corporation is a REIT that specializes in the owning and operating of farmland in the U.S.
The trust owns about 160 farms, comprising more than 100,000 acres of farmable land. Gladstone’s business is made up of three different options available to farmers, all of which are done on a triple-net basis.
The trust offers long-term sale leaseback transactions, traditional leases of farmland, and outright purchases of farm properties. Gladstone’s portfolio has an appraised value of over $1.5 billion.
Gladstone posted third quarter earnings on November 6th, 2025, and results were better than expected on both the top and bottom lines.
Funds-from-operations came to four cents, which was much better than the breakeven expected by analysts. Revenue was off 21% year-over-year to $17.79 million, but that was almost $3 million better than estimated.
The decline in revenue and earnings was due to lease structure changes, loss of revenue from asset sales, and ongoing tenant issues. Management noted fixed base cash rents were $5.4 million lower than the year-ago period, primarily due to lease modifications.
Participation rents were up $1.9 million, driven by earlier recognition of 2024 harvest payments and stronger pistachio pricing.
Core operating expenses fell by about $140k and related party fees fell by $110k. Recurring cash operating expenses were flat.
Click here to download our most recent Sure Analysis report on LAND (preview of page 1 of 3 shown below):
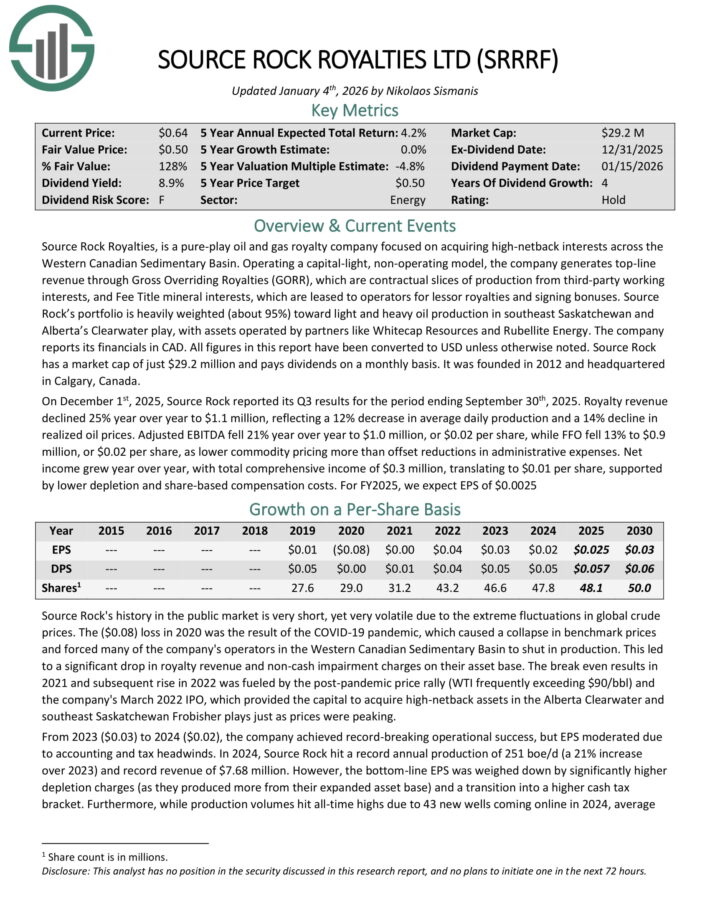
Red Flag Monthly Dividend Stock #3: Source Rock Royalties Ltd. (SRRRF)
Source Rock Royalties, is a pure-play oil and gas royalty company focused on acquiring high-netback interests across the Western Canadian Sedimentary Basin.
Operating a capital-light, non-operating model, the company generates top-line revenue through Gross Overriding Royalties (GORR), which are contractual slices of production from third-party working interests, and Fee Title mineral interests, which are leased to operators for lessor royalties and signing bonuses.
Source Rock’s portfolio is heavily weighted (about 95%) toward light and heavy oil production in southeast Saskatchewan and Alberta’s Clearwater play, with assets operated by partners like Whitecap Resources and Rubellite Energy.
Source Rock was founded in 2012 and headquartered in Calgary, Canada.
On December 1st, 2025, Source Rock reported its Q3 results. Royalty revenue declined 25% year over year to $1.1 million, reflecting a 12% decrease in average daily production and a 14% decline in realized oil prices.
Adjusted EBITDA fell 21% year over year to $1.0 million, or $0.02 per share, while FFO fell 13% to $0.9 million, or $0.02 per share, as lower commodity pricing more than offset reductions in administrative expenses.
Net income grew year over year, with total comprehensive income of $0.3 million, translating to $0.01 per share, supported by lower depletion and share-based compensation costs.
Click here to download our most recent Sure Analysis report on SRRRF (preview of page 1 of 3 shown below):
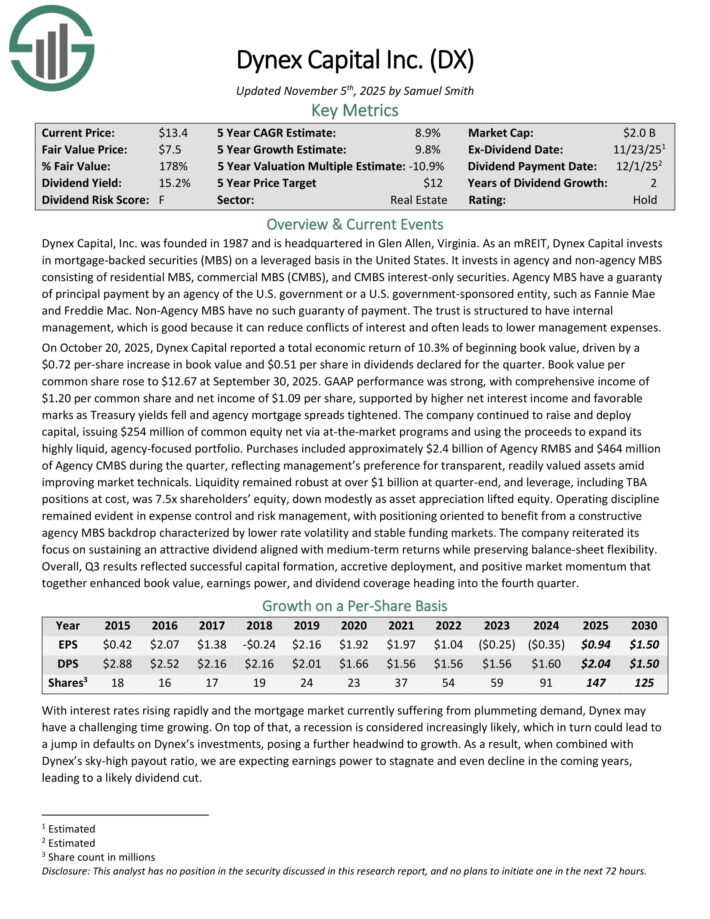
Red Flag Monthly Dividend Stock #2: Dynex Capital (DX)
Dynex Capital invests in mortgage–backed securities (MBS) on a leveraged basis in the United States. It invests in agency and non–agency MBS consisting of residential MBS, commercial MBS (CMBS), and CMBS interest–only securities.
On October 20, 2025, Dynex Capital reported a total economic return of 10.3% of beginning book value, driven by a $0.72 per-share increase in book value and $0.51 per share in dividends declared for the quarter.
Book value per common share rose to $12.67 at September 30, 2025. GAAP performance was strong, with comprehensive income of $1.20 per common share and net income of $1.09 per share, supported by higher net interest income and favorable marks as Treasury yields fell and agency mortgage spreads tightened.
The company continued to raise and deploy capital, issuing $254 million of common equity net via at-the-market programs and using the proceeds to expand its highly liquid, agency-focused portfolio.
Purchases included approximately $2.4 billion of Agency RMBS and $464 million of Agency CMBS during the quarter, reflecting management’s preference for transparent, readily valued assets amid improving market technicals.
Click here to download our most recent Sure Analysis report on DX (preview of page 1 of 3 shown below):
Red Flag Monthly Dividend Stock #1: Orchid Island Capital (ORC)
Orchid Island Capital is a mortgage REIT that is externally managed by Bimini Advisors LLC and focuses on investing in residential mortgage-backed securities (RMBS), including pass-through and structured agency RMBSs.
These financial instruments generate cash flow based on residential loans such as mortgages, subprime, and home-equity loans.
On October 23, 2025, Orchid Island Capital, Inc. reported estimated net income of $0.53 per common share for Q3 2025, with book value per share estimated at $7.33 as of September 30, 2025.
The company declared a monthly dividend of $0.12 per share for October, keeping consistent with its monthly payout strategy.
The RMBS portfolio and derivatives portfolio evolved as the company remained focused on agency residential mortgage-backed securities paired with hedging strategies.
Orchid Island highlighted that the investment backdrop remains attractive with improving spreads and prepayment risk manageable given the portfolio’s coupon distribution and hedges.
Prepayment activity remained a focal point, with management noting the need for continued vigilance given higher coupon pools and refinancing dynamics.
Click here to download our most recent Sure Analysis report on Orchid Island Capital, Inc. (ORC) (preview of page 1 of 3 shown below):

Final Thoughts
Monthly dividend stocks could be more appealing to income investors than quarterly or semi-annual dividend stocks. This is because monthly dividend stocks make 12 dividend payments per year, instead of the usual 4 or 2.
However, investors should also be concerned with the sustainability of a company’s dividend. Some monthly dividend stocks have unsustainable dividends, characterized by elevated dividend payout ratios above 100%.
As a result, these 10 red flag monthly dividend stocks could cut their dividends at some point in the future, particularly if a recession hits.
Further Reading
If you are interested in finding high-yield monthly dividend stocks, the following Sure Dividend resources will be useful:
Monthly Dividend Stock Individual Security Research
Thanks for reading this article. Please send any feedback, corrections, or questions to [email protected].


")


-1024x683.jpg "Strait Outta Hormuz: Getting the Iran Oil Story Straight")


