


The entire market is on edge right now …
See the Invesco QQQ Trust (QQQ) below for a visual example. It’s teetering on support, and there’s a lot of open space below it.
QQQ chart multi-day, 1-minute candles.
There are a few reasons for the weakness right now:
• Fears of an overvalued tech sector continue to weigh on major names.
• The precious metals sector just imploded.
• Bitcoin broke below key support.
• There’s a new Fed chair on deck.
And after months of bullish momentum in the market, we’re finally seeing some pullback across major sectors.
If you got caught up in the carnage … Don’t worry, you’re not alone.
My process protects traders from these pullbacks.
Those who blew up after the most recent freefall weren’t following the rules. They got emotional.
Whether you start with $1,000 or $10,000 … Control your emotions and follow the rules now.
The rules exist for a reason.
Protect Against a Fallout
I always tell traders:
• Don’t marry the trend.
• Take profits into strength.
• Cut losses quickly.
Every parabolic spike will eventually pull back.
The issue is: How do we take advantage of this strength and get out before it pulls back? And can you keep your emotions out of it?
The hottest stocks in the market like to follow a specific framework as they spike and ultimately crash.
It’s based on human psychology, fear and greed, which is why it repeats in the market over and over again. People have always behaved similarly during times of extreme emotion.
We see this pattern in the larger market from time to time.
Like on the recent surge, crash, and bounce in precious metal prices. The hype and emotion can take hold in any corner of the market.
But we see it strongest and most consistently among small-cap stocks. That’s where I focus most of my efforts.
Our job as traders is to recognize the emotion in the market from a third-party perspective. We don’t want to get caught up in the hype.
The Framework
There are seven steps to the life cycle of a stock spike that’s driven by human emotion.
Sometimes we see stocks make this move on a multi-day timeframe, sometimes it’s intraday.
Here are the steps:
1. Pre-spike base: Quiet consolidation and awareness building in the market.
2. Breakout/first green day: The stock surges with high volume. Momentum traders pile in.
3. Continuation/gap-and-go: There’s a follow-through session as the stock climbs higher.
4. Blow-off top: The parabolic move reaches exponentially until it stalls.
5. First red day (backside begins): The trend cracks. Bullish momentum completely fades.
6. Panic washout: A capitulation flush creates potential morning panic dip buy opportunities for disciplined longs.
7. Bounce/base rebuild: There are smaller and smaller bounces as the price fades. Then a new base forms to prepare for the next cycle’s steps 1 and 2. Past spikers can spike again.
You can see the steps play out in these charts below of Gaxos.ai Inc. (GXAI).
The first chart shows candles that represent one trading day, showcasing the multi-day framework:
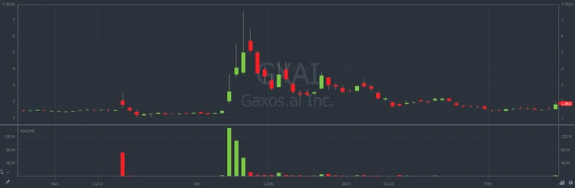
GXAI chart multi-month, 1-day candles.
The second chart shows the framework intraday:
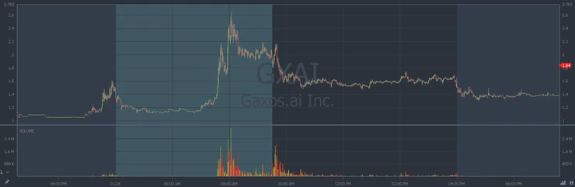
GXAI chart multi-month, 1-day candles.
Every spike is a little unique, like a snowflake, but you can’t deny the similarity of those charts.
And they’re on completely different time frames.
That’s human psychology as it manifests in the stock market.
Trade Patterns That Repeat
You don’t need to be a genius or a math wiz to find success as a trader.
All it takes is discipline.
Discipline to study the same patterns over and over again. Discipline to stick to the plan as you size up. And discipline to cut your losses quickly.
If you have any questions, email me at [email protected].
Cheers,
 Tim SykesEditor, Tim Sykes Daily


-1024x683.jpg "Strait Outta Hormuz: Getting the Iran Oil Story Straight")


