

Article updated on December 19th, 2025 by Nathan ParshSpreadsheet data updated daily
Income investors looking for compounding dividends over time, should consider high-quality dividend growth stocks. These stocks have the ability to raise their dividends over time, thereby unleashing the power of compounding dividends.
This is why Sure Dividend often recommends the Dividend Aristocrats, a select group of 69 S&P 500 stocks with 25+ years of consecutive dividend increases.
They are the ‘best of the best’ dividend growth stocks. The Dividend Aristocrats have a long history of compounding dividends for shareholders.
There are currently 66 Dividend Aristocrats. You can download an Excel spreadsheet of all 69 Dividend Aristocrats (with metrics that matter such as dividend yields and price-to-earnings ratios) by clicking the link below:

Disclaimer: Sure Dividend is not affiliated with S&P Global in any way. S&P Global owns and maintains The Dividend Aristocrats Index. The information in this article and downloadable spreadsheet is based on Sure Dividend’s own review, summary, and analysis of the S&P 500 Dividend Aristocrats ETF (NOBL) and other sources, and is meant to help individual investors better understand this ETF and the index upon which it is based. None of the information in this article or spreadsheet is official data from S&P Global. Consult S&P Global for official information.
Dividend Aristocrats must have 25+ years of rising dividends, be a member of the S&P 500 Index, and meet certain minimum size and liquidity requirements.
Due to their strong dividend history and durable competitive advantages, the Dividend Aristocrats are a great place to start looking for compounding dividends.
This article will explain the concept of compounding dividends in greater detail, as well as a list of the top 10 stocks for compounding dividends right now.
Table of Contents
You can instantly jump to any specific section of the article by using the links below:
What Is Compounding Dividends?
Put simply, compounding is the act of earning interest on previously-earned interest. In this way, investors could think of compounding like the snowball effect.
When you push a small snowball down a hill, it continuously picks up snow. When it reaches the bottom of the hill it is a giant snow boulder.
The snowball compounds during its travel down the hill. The bigger it gets, the more snow it packs on with each revolution.
The snowball effect explains how small actions carried out over time can lead to big results.
In the same way, investing in high-quality dividend growth stocks can generate large amounts of dividend income over long periods of time.
That’s because dividend growth stocks tend to pay rising dividends every year. And then you can reinvest those rising dividends to purchase more shares each year.
This results in an increase in the total number of shares you own, as well as an increase in the dividend per share, for a powerful compounding effect.
Here’s the power of compound interest:
Imagine you invested $1 that compounded at 1% a day. In 5 years your $1 would grow to over $77 million. You would be the richest person in the world by year 7.
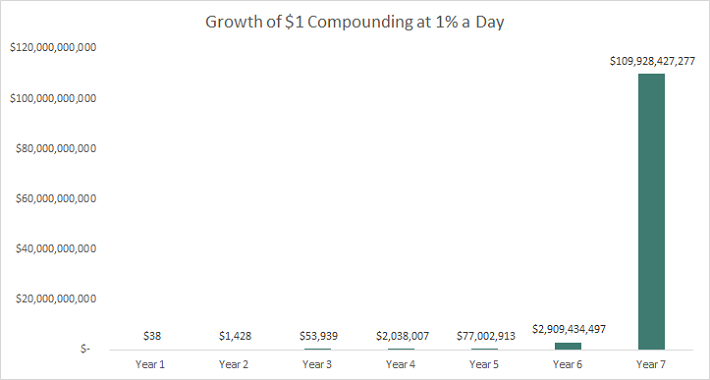
Keep in mind that compounding is not a get rich quick scheme. It takes time – and lots of it. There are no investments that compound at 1% a day in the real world.
The stock market has compounded wealth (adjusting for inflation) at ~7% a year over the long run. At this rate an investment in the stock market has historically doubled every 10.4 years.
The 10 Best Stocks For Compounding Dividends
The following 10 stocks are our top-ranked stocks for compounding dividends, based on a qualitative assessment of dividend history, current yield, and payout ratios.
All the stocks in the list below have current yields above 2%, at least 25 consecutive years of dividend increases, and payout ratios below 70%.
In addition, the 10 best stocks for compounding dividends below have Dividend Risk Scores of A or B.
This combination is likely to result in sustained dividend increases over time, thereby compounding dividends to create long-term wealth.
The stocks are ranked in order of their 5-year dividend growth rate, from lowest to highest.
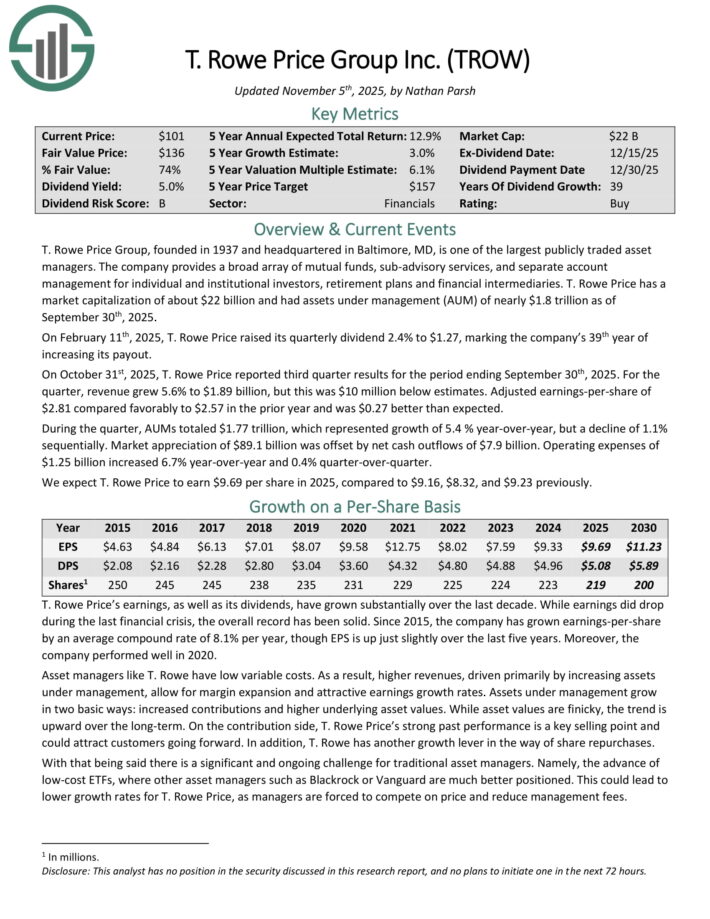
#10: T. Rowe Price Group Inc. (TROW)
Payout Ratio: 52%
Years of Dividend Increases: 39
5-Year Dividend Growth Rate: 3.
T. Rowe Price Group, founded in 1937 and headquartered in Baltimore, MD, is one of the largest publicly traded asset managers. The company provides a broad array of mutual funds, sub-advisory services, and separate account management for individual and institutional investors, retirement plans, and financial intermediaries. T. Rowe Price has a market capitalization of about $22 billion and had assets under management (AUM) of nearly $1.8 trillion as of the end of Q3 2025.
T. Rowe Price announced third-quarter results on October 31st, 2025.

Source: Investor Resources
Revenue for the quarter grew 5.6% to $1.89 billion, though this was $10 million less than expected. Adjusted earnings-per-share of $2.81 compared favorably to $2.57 in the prior year and was $0.27 above estimates.
During the quarter, AUMs totaled $1.77 trillion, which represented growth of 5.4 % year-over-year, but a decline of 1.1% sequentially. Market appreciation of $89.1 billion was offset by net cash outflows of $7.9 billion. Operating expenses of $1.25 billion increased 6.7% year-over-year and 0.4% quarter-over-quarter.
Click here to download our most recent Sure Analysis report on TROW (preview of page 1 of 3 shown below):
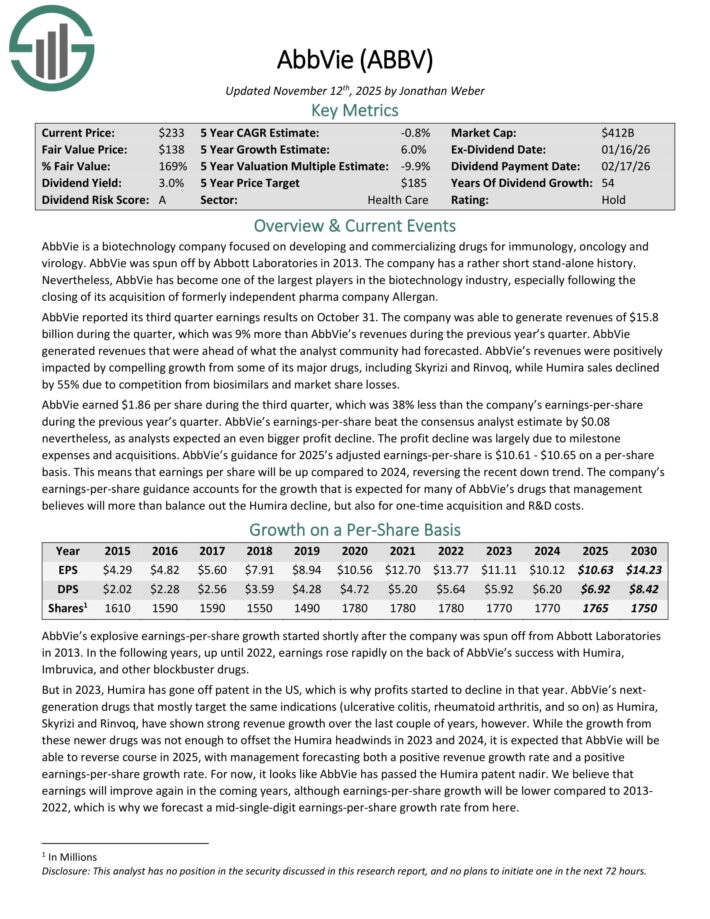
#9: AbbVie (ABBV)
Payout Ratio: 65%
Years of Dividend Increases: 55
5-Year Dividend Growth Rate: 5.0%
AbbVie is a biotechnology company focused on developing and commercializing drugs for immunology, oncology, and virology. AbbVie was spun off by Abbott Laboratories in 2013. The company has a rather short stand-alone history. Nevertheless, AbbVie has become one of the largest players in the biotechnology industry, especially following the closing of its acquisition of formerly independent pharma company Allergan.
On October 31st, 2025, AbbVie announced that it was raising its quarterly dividend 5.5% to $1.73 per share.
That same day, the company reported third-quarter results. Revenue grew 9% to $15.8 billion, which was $190 million more than expected. Adjusted earnings-per-share of $1.86 compared unfavorably to $3.00 in the prior year, but this was $0.8 above estimates.
AbbVie’s revenues were positively impacted by compelling growth from some of its major drugs, including Skyrizi and Rinvoq, while Humira sales declined by 55% due to competition from biosimilars and market share losses. The profit decline was largely due to milestone expenses and acquisitions.
AbbVie’s guidance for 2025’s adjusted earnings-per-share is $10.61 – $10.65 on a per-share basis. This means that earnings per share will be up compared to 2024, reversing the recent down trend.
Click here to download our most recent Sure Analysis report on ABBV (preview of page 1 of 3 shown below):
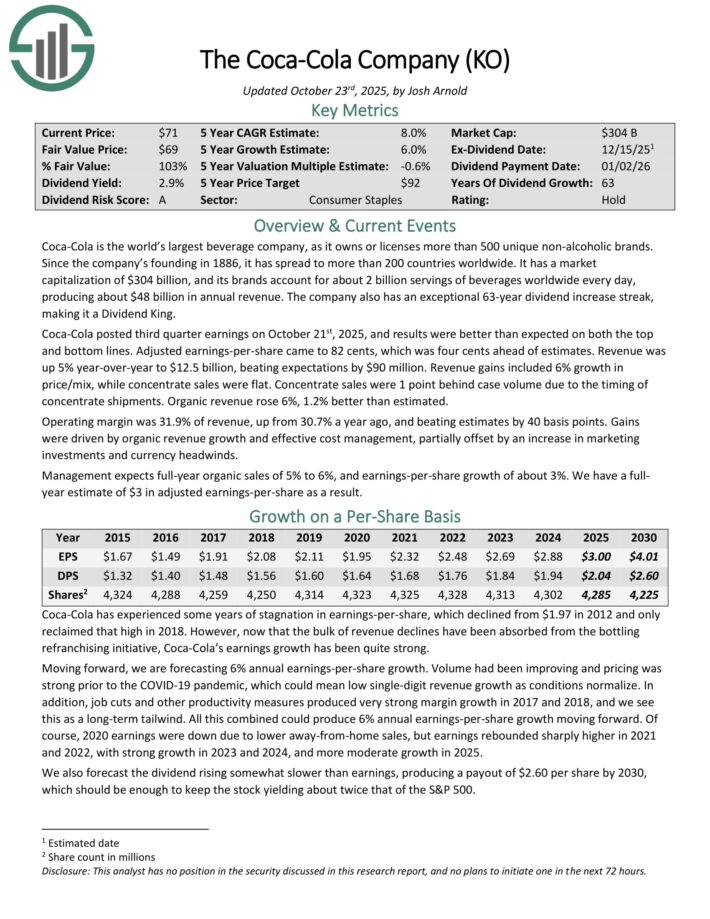
#8: The Coca-Cola Company (KO)
Payout Ratio:68%
Years of Dividend Increases: 63
5-Year Dividend Growth Rate: 5.0%
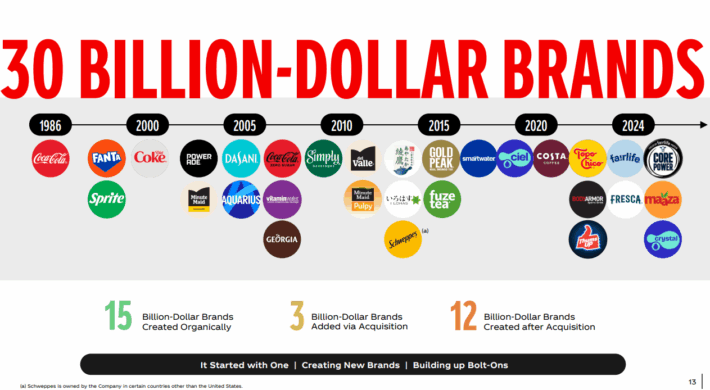
Coca-Cola is one of the largest beverage companies in the world, as it owns or licenses more than 500 unique non-alcoholic brands. The $300 billion company has operations in more than 200 countries worldwide. The company’s products are served about 2 billion times each day, producing annual revenue of close to $48 billion. The company’s portfolio includes 30 brands that generate at least $1 billion in annual revenue.
Source: Investor Presentation
Coca-Cola released third-quarter earnings results on October 21st, 2025, with results that were above estimates on both the top and bottom lines. Adjusted earnings-per-share of $0.82 was $0.04 better than expected while revenue of $12.5 billion was $90 million more than anticipated.
Revenue gains were supported by a 6% improvement in price/mix while concentrate sales were unchanged. Concentrate sales were 1 point behind case volume due to the timing of concentrate shipments. Organic revenue grew 6%, which was 1.2% better than expected.
The operating margin expanded 120 basis points to 31.9%, which was 40 basis points more than projected. Gains were driven by organic revenue growth and effective cost management, partially offset by an increase in marking investment and currency headwinds.
Click here to download our most recent Sure Analysis report on KO (preview of page 1 of 3 shown below):
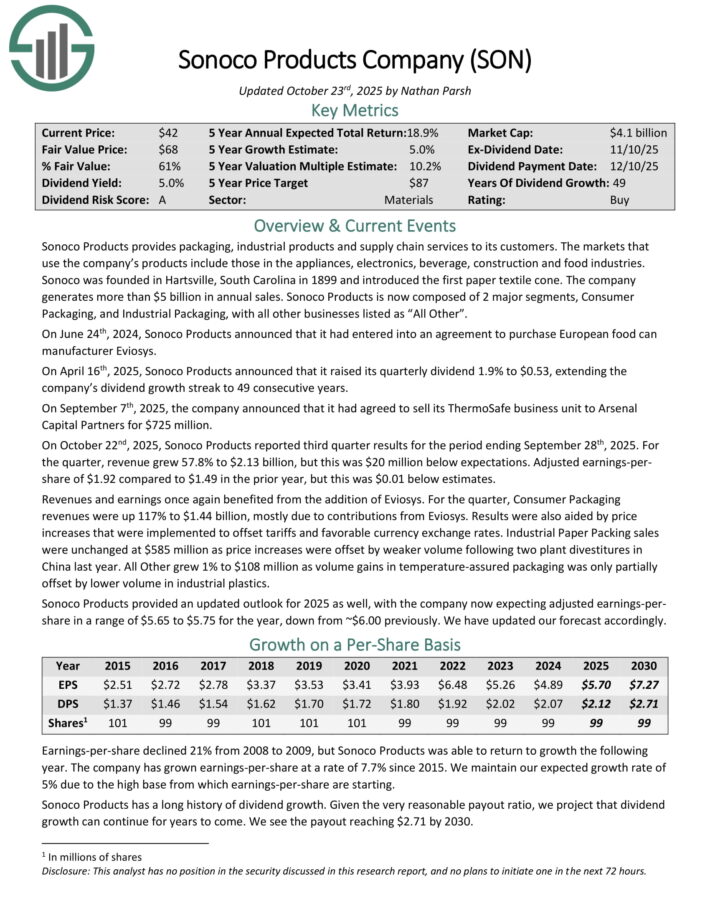
#7: Sonoco Products Company (SON)
Payout Ratio: 37%
Years of Dividend Increases: 49
5-Year Dividend Growth Rate: 5.0%
Sonoco Products Company provides packaging, industrial products, and supply chains services to its customers. The markets that use the company’s products include those in the appliances, electronics, beverage, construction and food industries. Sonoco Products is now composed of 2 major segments, Consumer Packaging, and Industrial Packaging, with all other businesses listed as “All Other”.
Sonoco Products reported third-quarter results on October 22nd, 2025.

Source: Investor Presentation
Revenue for the quarter surged 58% to $2.13 billion, though this was $20 million less than expected. Adjusted earnings-per-share of $1.92 compared favorably to $1.49 in the prior year, but this was $0.01 below estimates.
As with prior quarters, revenue and earnings-per-share benefited from the company’s purchase of Eviosys in December of 2024.
Revenue for Consumer Packing was up 117% to $1.44 billion, mostly due to contributions from Eviosys. Results were also positively impacted by price increases that were implemented to offset tariffs.
Industrial Paper Packing sales were unchanged at $585 million as price increases were offset by weaker volume resulting from two plant divestitures in China last year.
All Other grew 1% to $108 million due to volume gains in temperature-assured packaging.
Click here to download our most recent Sure Analysis report on SON (preview of page 1 of 3 shown below):
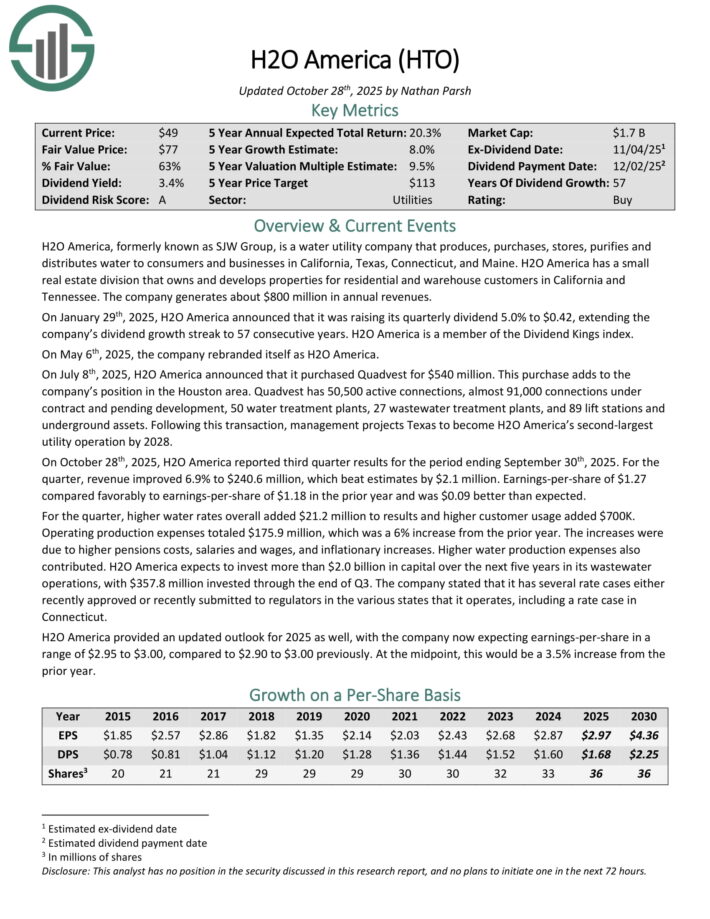
#6: H2O America (HTO)
Payout Ratio: 57%
Years of Dividend Increases: 57
5-Year Dividend Growth Rate: 6.0%
H2O America, formerly known as SJW Group, is a water utility company that produces, purchases, stores, purifies and distributes water to consumers and businesses in California, Texas, Connecticut, and Maine. H2O America has a small real estate division that owns and develops properties for residential and warehouse customers in California and Tennessee.
Source: Investor Relations
H2O America reported third-quarter results on October 28th, 2025. Revenue for the period grew 6.9% to $240.6 million and topped expectations by $2.1 million. Earnings-per-share of $1.27 was up from $1.18 in the same period of the prior year and was $0.09 ahead of estimates.
Water rates added $21.2 million to results while higher customer usage contributed $700K. Operating expenses increased 6% to $175.9 million as pensions costs, salaries and wages, and inflationary increases did impact the business.
H2O America expects to invest more than $2 billion in capital over the next five years in its wastewater operations. The company invested nearly $358 million through the end of the third-quarter.
The company also noted it had received approval for several rate cases during the quarter as well as recently submitted rate cases to regulators.
Click here to download our most recent Sure Analysis report on HTO (preview of page 1 of 3 shown below):
#5: Johnson & Johnson (JNJ)
Payout Ratio: 48%
Years of Dividend Increases: 63
5-Year Dividend Growth Rate: 6.0%
Johnson & Johnson is a diversified health care company and a leader in innovative medicines and medical devices Johnson & Johnson was founded in 1886 and employs nearly 138,000 people around the world. The company is projected to generate more than $93 billion in revenue this year.
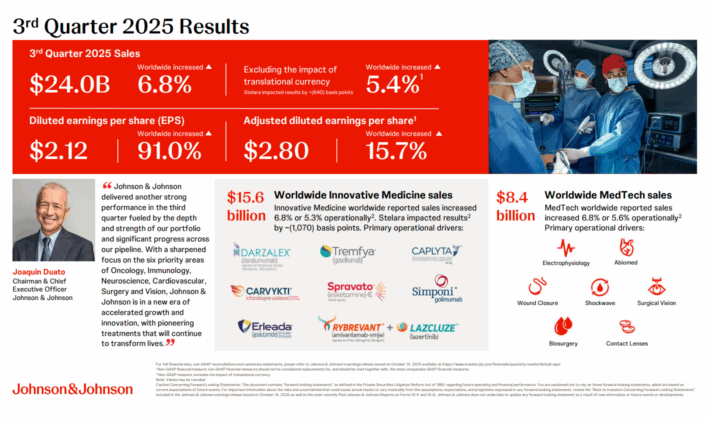
On October 14th, 2025, Johnson & Johnson reported third-quarter results for period ending September 30th, 2025.
Source: Investor Presentation
For the quarter, revenue grew 6.7% to $24 billion, which beat estimates by $240 million. Adjusted earnings-per-share of $2.80 compared to $2.42 in the prior year and was $0.04 better than expected.
Revenue for Innovative Medicines grew 6.8%. Infectious Disease decreased 0.9% on a reported basis as growth in Edurant, which is used to treat HIV, was more than offset by weakness in the rest of the portfolio. Oncology grew 21.3% due to ongoing high demand for Darzalex, which treats multiple myeloma, and continued high demand in several other products.
Immunology was down 9.8%. Weakness for Stelara, which treats immune-mediated inflammatory diseases, was once again due to biosimilar competition. Offsetting this was ongoing market share gains for Tremfya, which treats chronic inflammatory conditions such as plaque psoriasis and arthritis. Remicade, which treats autoimmune diseases such as Crohn’s disease, benefited from a one-time favorable patient mix adjustment.
Revenue for MedTech grew 6.8%. Cardiovascular continues to produce excellent results, as sales were higher by 12.6% due to new products. Surgery had sales growth of 4.4% as gains in biosurgery and endocutters was offset by tougher competition in energy.
Orthopaedics returned to growth, with revenue improving 3.8% due to new products and an increase in demand for knees and hips products. The company announced that it plans to separate its orthopedics business into a standalone company called “DePuy Synthes” within the next 18 to 24 months.
Click here to download our most recent Sure Analysis report on JNJ (preview of page 1 of 3 shown below):
#4: PepsiCo Inc. (PEP)
Payout Ratio: 70%
Years of Dividend Increases: 53
5-Year Dividend Growth Rate: 6.0%
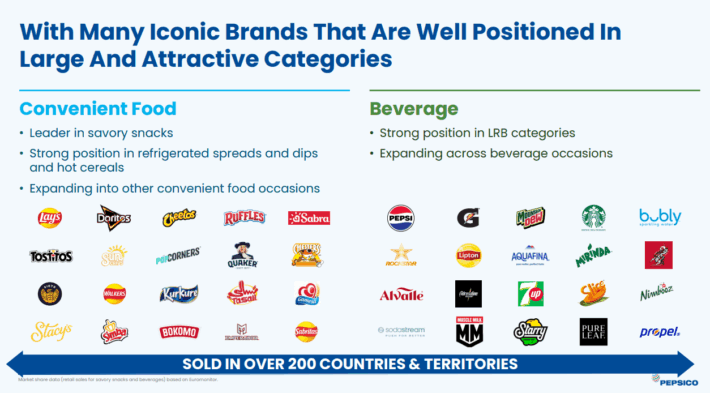
PepsiCo is a global food and beverage company that generates annual sales of nearly $92 billion. The company has an impressive portfolio of brands.
Source: Investor Relations
This includes leading brands such as Pepsi, Mountain Dew, Frito-Lay chips, Gatorade, Tropicana, and Quaker foods. The company has more than 20 $1 billion brands.
On October 9th, 2025, PepsiCo reported third-quarter results, with revenue growing 2.7% to $23.9 billion, which was $90 million more than expected. Adjusted earnings-per-share of $2.29 was down from $2.31 in the prior year, but $0.03 ahead of estimates. Currency exchange did lower results by 2% for adjusted earnings-per-share.
Organic sales were up 1.3% for the period. Food and beverage volumes fell 1% year-over-year. PepsiCo Beverages North America had organic growth of 2% despite a 3% decline in volume.
PepsiCo Foods North America declined 3%, mostly on account of divestitures. Food volume was lower by 4%.
International Beverages fell 1%, mostly due to lower volume. Revenues in Europe/Middle East/Arica were up 5.5% while Latin America improved 4%, and Asia Pacific increased 1%.
Click here to download our most recent Sure Analysis report on PEP (preview of page 1 of 3 shown below):

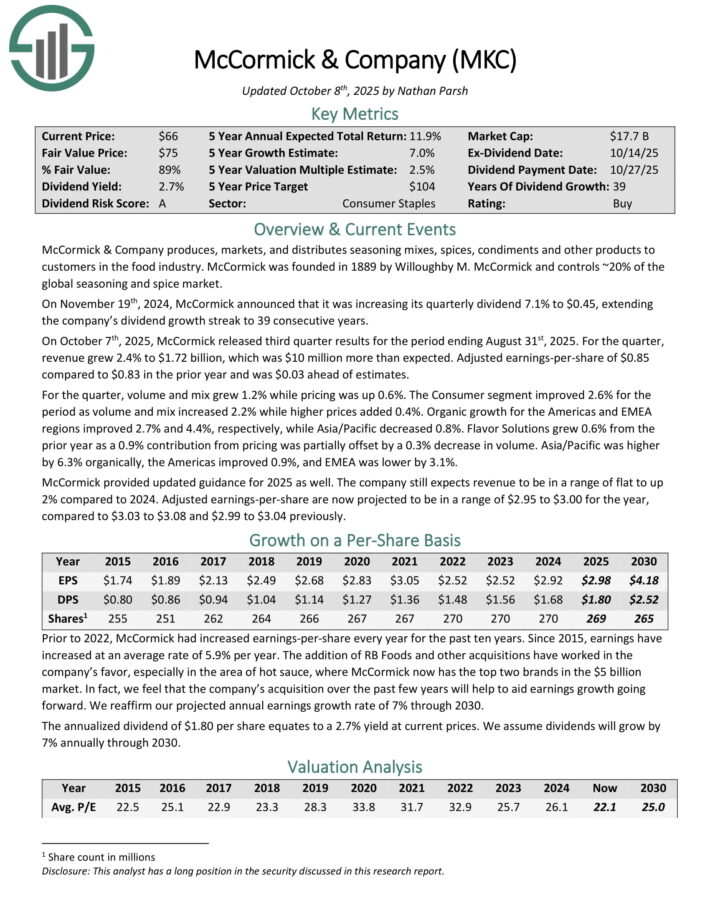
#3: McCormick & Company (MKC)
Payout Ratio: 60%
Years of Dividend Increases: 39
5-Year Dividend Growth Rate: 7.0%
McCormick & Company produces, markets, and distributes seasoning mixes, spices, condiments and other products to customers in the food industry. McCormick was founded in 1889 by Willoughby M. McCormick and controls ~20% of the global seasoning and spice market.
McCormick announced third-quarter results on October 7th, 2025.
Source: Investor presentation
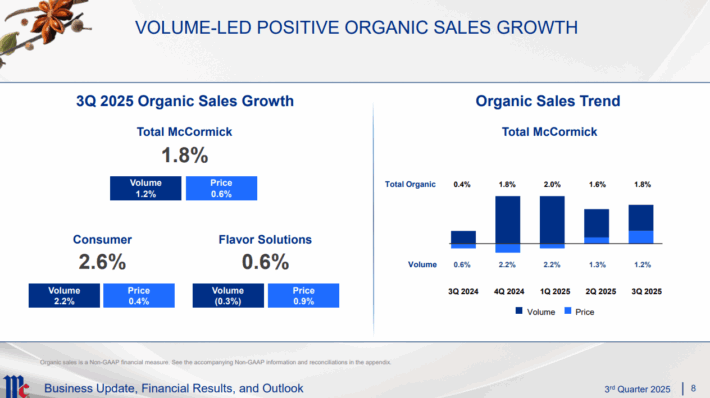
Revenue increased 2.4% year-over-year to $1.72 billion, which beat estimates by $10 million. Adjusted earnings-per-share of $0.85 compared to $0.83 in the prior year and was $0.03 better than expected.
Volume and mix improved 1.2% while pricing was up 0.6%. The Consumer segment improved 2.6% for the period as volume and mix increased 2.2% while higher prices added 0.4%. Organic growth for the Americas and EMEA regions improved 2.7% and 4.4%, respectively, while Asia/Pacific decreased 0.8%.
Flavor Solutions grew 0.6% from the prior year as a 0.9% contribution from pricing was partially offset by a 0.3% decrease in volume. Asia/Pacific was higher by 6.3% organically, the Americas improved 0.9%, and EMEA was lower by 3.1%.
Click here to download our most recent Sure Analysis report on MKC (preview of page 1 of 3 shown below):
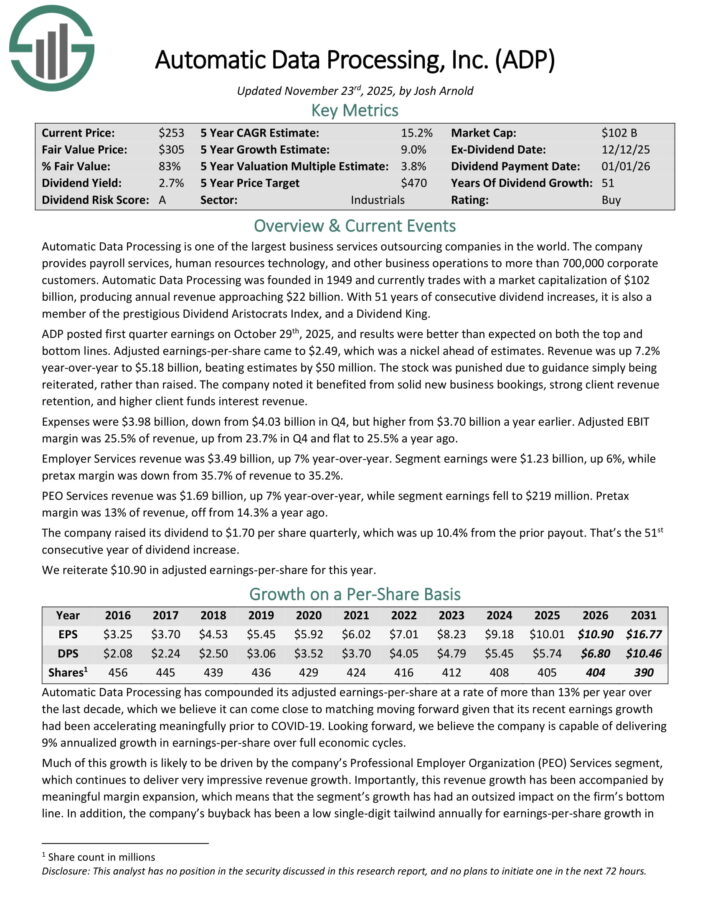
#2: Automatic Data Processing (ADP)
Payout Ratio: 62%
Years of Dividend Increases: 51
5-Year Dividend Growth Rate: 9.0%
Automatic Data Processing is one of the largest business services outsourcing companies in the world, with more than 700,000 corporate customers. The company provides payroll services, human resources technology, and other business operations. The company generates nearly $22 billion of annual revenues.
Automatic Data Processing released Q1 earnings results on October 29th, 2025.

Source: Investor Presentation
Adjusted earnings-per-share of $2.49 was $0.05 better than expected while revenue grew 7.2% to $5.18 billion and beat estimates by $50 million.
Employer Services revenue improved 7% to $3.49 billion while segment earnings were up 6% to $1.23 billion. PEO Service revenue also increased 7% to $1.69 billion, though segment earnings were down to $219 million.
Automatic Data Processing also has raised its dividend 10.4% to $1.70, extending the company’s dividend growth streak to 51 consecutive years.
Click here to download our most recent Sure Analysis report on ADP (preview of page 1 of 3 shown below):
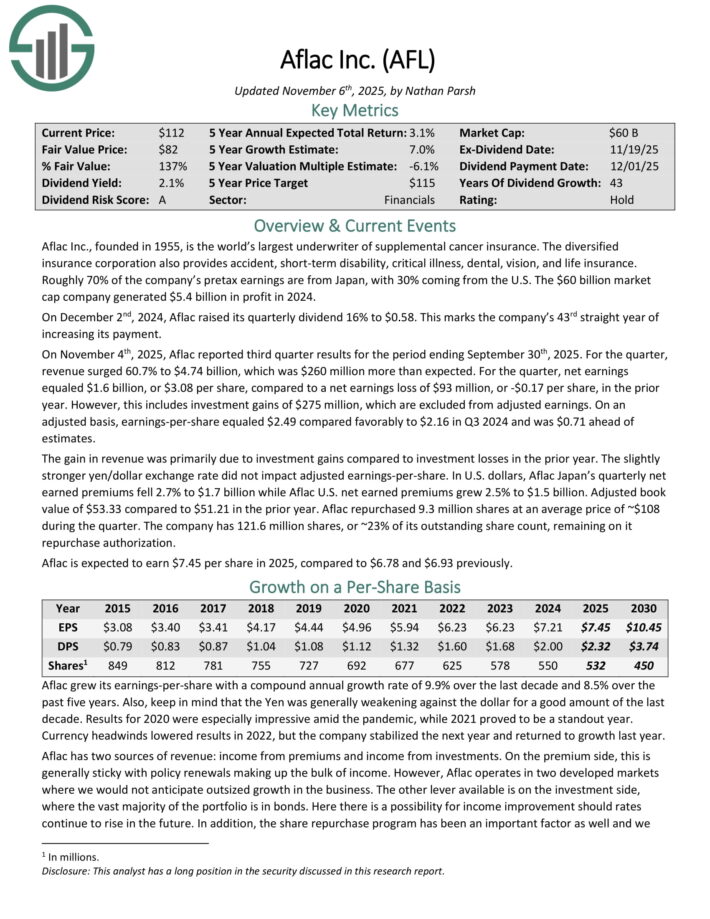
#1: Aflac Inc. (AFL)
Payout Ratio: 33%
Years of Dividend Increases: 44
5-Year Dividend Growth Rate: 10.0%
Aflac Inc, which was founded in 1955, is the world’s largest underwriter of supplement cancer insurance. The diversified insurance corporation also provides accident, short-term disability, critical illness, dental, vision, and life insurance. Nearly 70% of pretax earnings are from Japan, with the remaining coming from the U.S. The company generated $5.4 billion of profit last year.
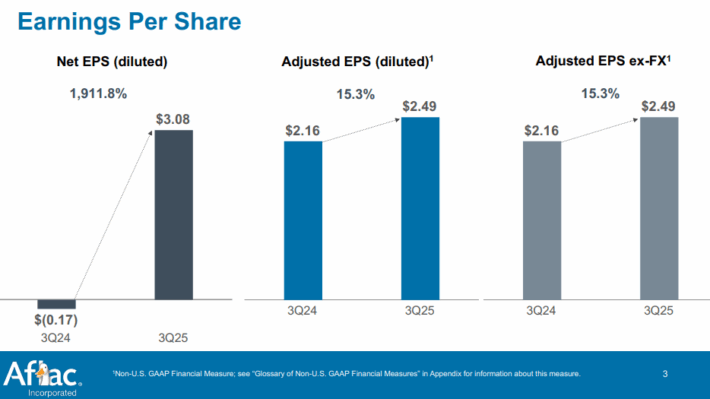
Aflac reported third-quarter results on November 4th, 2025.
Source: Investor Presentation
Revenue was up nearly 61% to $4.74 billion, which was $260 million more than expected. Net earnings of $1.6 billion, or $3.08 per share, compared to a net earnings loss of $93 million, or -$0.17 per share in the prior year. However, this includes investment gains of $275 million, which are excluded from adjusted earnings. On an adjusted basis, earnings-per-share equaled $2.49 compared to $2.16 in Q3 2024 and was $0.71 above estimates.
The gain in revenue was primarily due to investment gains compared to investment losses in the same period of the previous year. In U.S. dollars, Aflac Japan’s quarterly net earned premiums decreased 2.7% to $1.7 billion while Aflac U.S. net earned premiums improved 2.5% to $1.5 billion. The company’s adjusted book value of $53.33 compared to $51.21 in the prior year.
Aflac repurchased more than 9 million shares at an average price of $108 during the quarter. The company’s remaining repurchase authorization is for 121.6 million shares, or about a quarter of its outstanding share count.
On November 11th, 2025, Aflac announced that it was raising its quarterly dividend by 5.2%, increasing the company’s dividend growth streak to 44 years.
Click here to download our most recent Sure Analysis report on AFL (preview of page 1 of 3 shown below):
Final Thoughts
High-quality dividend growth stocks can build long-term wealth for shareholders. A major reason for this is the combination of dividend growth and dividend reinvestment.
The 10 stocks listed in the article represent some of the best stocks for dividend compounding.
Sure Dividend maintains similar databases on the following useful universes of stocks:
Thanks for reading this article. Please send any feedback, corrections, or questions to [email protected].


")


