

Updated on October 22nd, 2025 by Bob Ciura
Spreadsheet data updated daily
The technology industry is one of the most exciting areas of the stock market, known for its rapid growth and propensity to create rapid and life-changing wealth for early investors.
Until recently, the technology sector was not known for being a source of high-quality dividend investment ideas. This is no longer the case.
Today, some of the most appealing dividend stocks come from the tech sector.
With that in mind, we’ve compiled a list of 130+ technology stocks complete with important investing metrics, which you can access below:

The holdings of the technology stocks list were derived from the following major exchange-traded funds:
Technology Select Sector SPDR ETF (XLK)
Invesco S&P SmallCap Information Technology ETF (PSCT)
Keep reading this article to learn more about the benefits of investing in dividend-paying technology stocks.
In addition to providing a full spreadsheet of tech stocks and how to use the spreadsheet, we give our top 10-ranked tech stocks today in terms of 5-year expected annual returns.
Table Of Contents
The following table of contents allows you to instantly jump to any section:
How To Use The Technology Stocks List To Find Dividend Investment Ideas
Having an Excel document containing the names, tickers, and financial metrics for all dividend-paying technology stocks can be extremely powerful.
The document becomes significantly more powerful if the user has a working knowledge of Microsoft Excel.
With that in mind, this section will show you how to implement two actionable investing screens to the technology stocks list. The first screen that we’ll implement is for stocks with dividend yields above 3%.
Screen 1: High Dividend Yield Technology Stocks
Step 1: Download the technology stocks list at the link above.
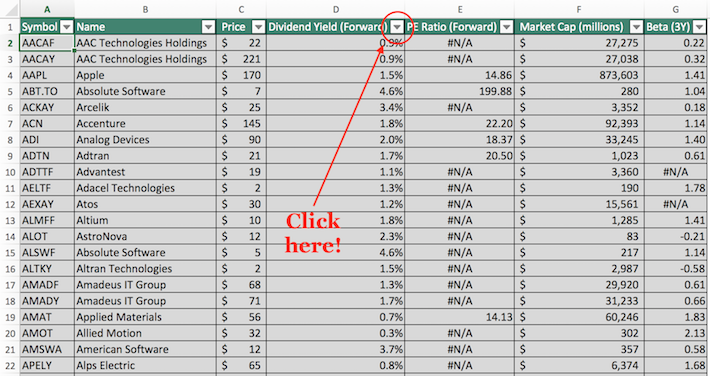
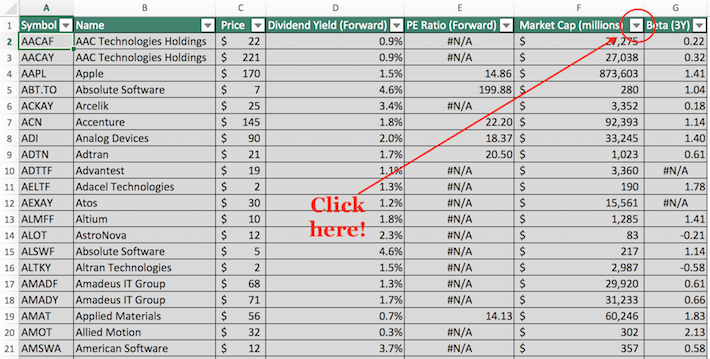
Step 2: Click on the filter icon at the top of the dividend yield column, as shown below.
Step 3: Change the filter setting to “Greater Than” and input 0.03 into the field beside it, as shown below.
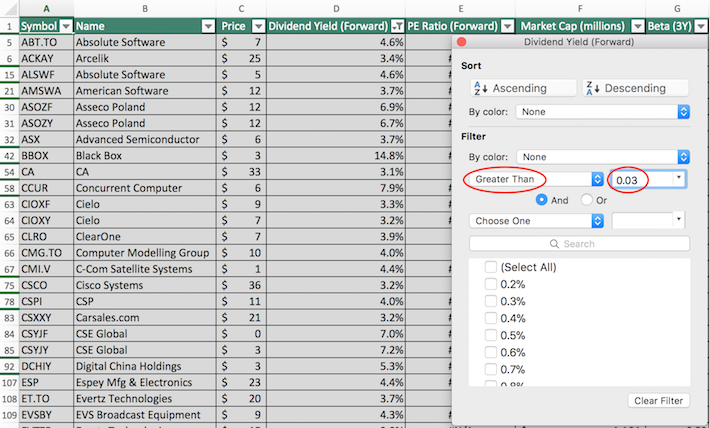
The remaining stocks in this spreadsheet are dividend-paying technology stocks with dividend yields above 3%, which provide a basket of securities that should appeal to retirees and other income-oriented investors.
The next section will show you how to simultaneously screen for stocks with price-to-earnings ratios below 20 and market capitalizations above $10 billion.
Screen 2: Low Price-to-Earnings Ratios, Large Market Capitalizations
Step 1: Download the technology stocks list at the link above.
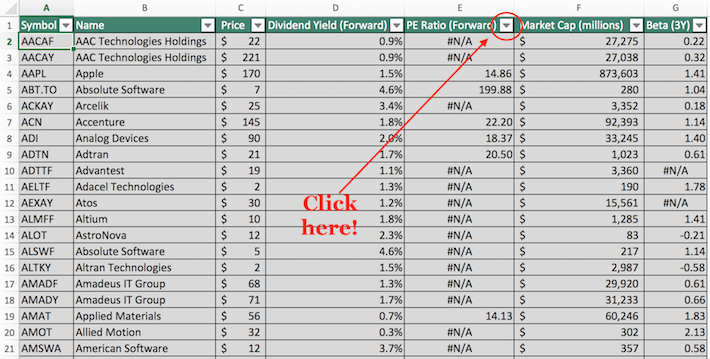
Step 2: Click on the filter icon at the top of the price-to-earnings ratio column, as shown below.
Step 3: Change the filter setting to “Less Than” and input 20 into the field beside it, as shown below.
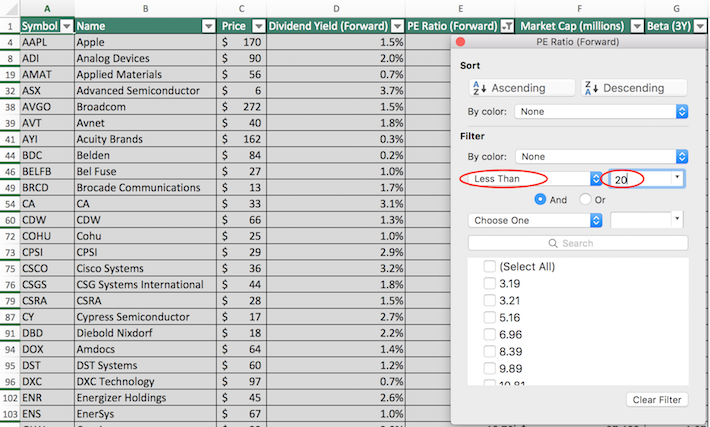
Step 4: Exit out of the filter window (by clicking the exit button, not by clicking the Clear Filter button). Then, click on the filter icon at the top of the market capitalization button, as shown below.
Step 5: Change the filter setting to “Greater Than” and input 10000 into the field beside it, as shown below. Note that since market capitalization is measured in millions of dollars in this spreadsheet, inputting “$10,000 million” is equivalent to screening for stocks with market capitalizations above $10 billion.
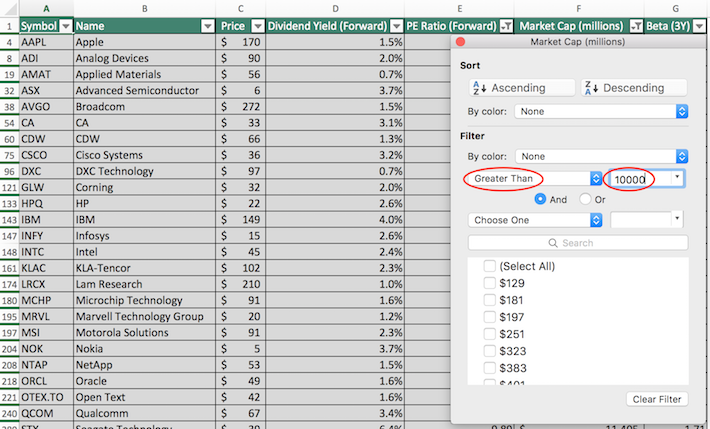
The remaining stocks in the Excel spreadsheet are dividend-paying technology stocks with price-to-earnings ratios below 20 and market capitalizations above $10 billion. The size and reasonable valuation of these businesses make this a useful screen for value-conscious, risk-averse investors.
You now have an understanding of how to use the technology stocks list to find investments with certain financial characteristics. The remainder of this article will discuss the relative merits of investing in the technology sector.
Why Invest In The Technology Sector?
The technology industry is known for having some of the best-performing stocks over time. Indeed, it’s hard to overstate how much wealth was created for the early investors in companies like Microsoft (MSFT) or Apple (AAPL).
In addition, the technology sector is highly diversified. It includes everything from social media companies to semiconductor stocks. The technology sector itself is not a monolith; there are many types of businesses within the sector.
The technology industry is also known for causing one of the most dramatic stock market bubbles on record. The 2000-2001 dot-com bubble destroyed billions of dollars of market value because technology stocks were trading at such irrationally high valuations.
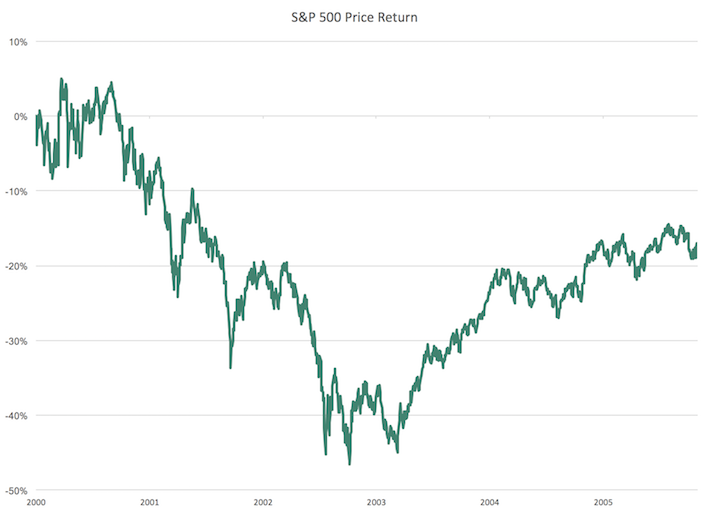
Source: YCharts
This notable bear market might lead some investors to avoid the technology sector entirely.
Fortunately, today’s technology sector is tremendously different from its predecessor in the early 2000s. While technology stocks were previously valued based on page views or other vanity metrics, this school of thought has changed significantly.
Today’s technology stocks are valued based on the same yardsticks as other businesses: earnings, free cash flow, and, to a lesser extent, assets.
Moreover, careful security analysis allows investors to find undervalued technology stocks and profits, just as with any other industry.
Investors might also avoid tech stocks because of a perceived inability to understand how they make money.
While some investors ignore technology stocks because of their harder-to-understand business models, it’s important to note that not all technology stocks have business operations that are shrouded in complexity.
As an example, Apple has a very simple business model. The company manufactures and sells iPhones, Mac computers, and wearable devices. It also makes money from services through its hardware devices such as the App Store and iTunes.
Moreover, one could argue that Apple’s greatest strength is not its technology, but its brand – similar to many non-technology companies like the Coca-Cola Company (KO), Procter & Gamble (PG), and Colgate-Palmolive (CL).
Importantly, there are opportunities similar to Apple throughout the sector – not all technology stocks have competitive advantages that are based on microchip capacity or cloud computing speed.
The last reason why technology stocks can play an important role in your investment portfolio is that they have the potential to be very strong dividend stocks.
Historically, the technology sector was devoid of any appealing dividend investments because technology firms reinvested all money to drive rapid organic growth.
This is no longer the case, at least not in general. Many technology firms now pay steadily rising dividends year in and year out.
The profits of these large, stable technology companies are only growing. And, many technology firms have fairly low payout ratios.
These factors lead us to believe that the technology sector will continue to provide strong dividend growth investment opportunities for the foreseeable future.
The Top 10 Tech Stocks Today
With all that said, the following 10 stocks represent our highest-ranked tech stocks in the Sure Analysis Research Database, in terms of 5-year expected annual returns.
Rankings are listed in order of expected total annual returns, in order from lowest to highest.
Tech Dividend Stock #10: Microsoft Corporation (MSFT)
5-Year Annual Expected Returns: 7.9%
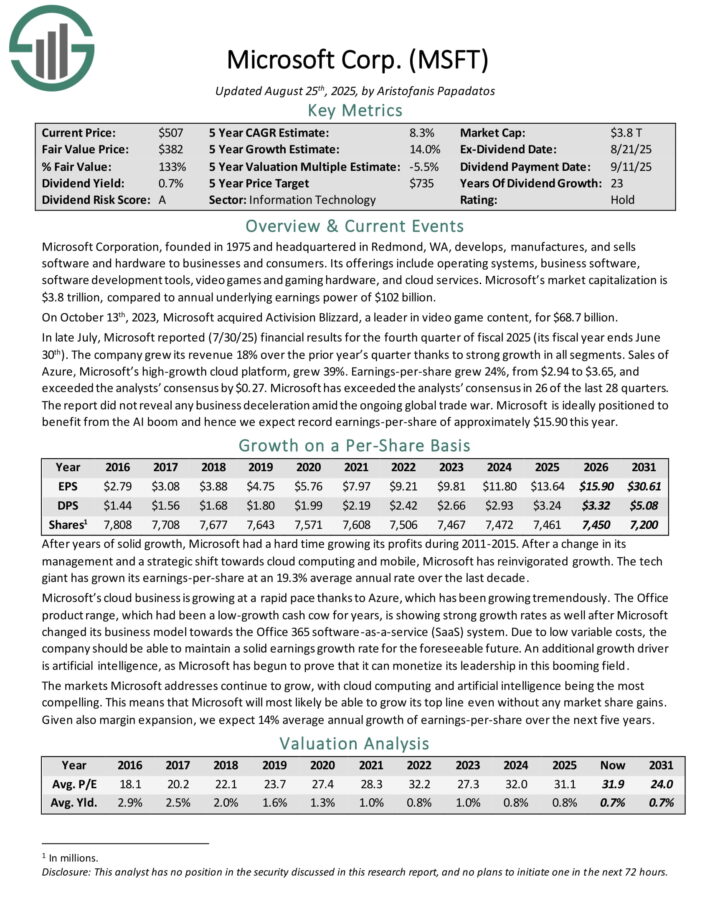
Microsoft Corporation manufactures and sells software and hardware to businesses and consumers. Its offerings include operating systems, business software, software development tools, video games and gaming hardware, and cloud services.
In late July, Microsoft reported (7/30/25) financial results for the fourth quarter of fiscal 2025 (its fiscal year ends June 30th). The company grew its revenue 18% over the prior year’s quarter thanks to strong growth in all segments. Sales of Azure, Microsoft’s high-growth cloud platform, grew 39%.
Earnings-per-share grew 24%, from $2.94 to $3.65, and exceeded the analysts’ consensus by $0.27. Microsoft has exceeded the analysts’ consensus in 26 of the last 28 quarters.
Click here to download our most recent Sure Analysis report on MSFT (preview of page 1 of 3 shown below):
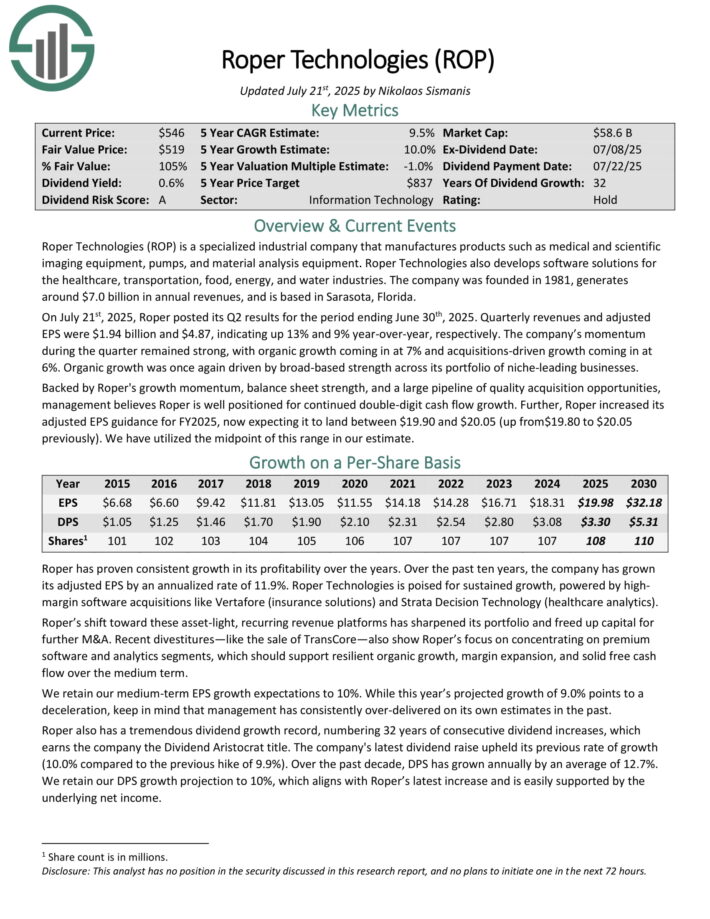
Tech Dividend Stock #9: Roper Technologies (ROP)
5-Year Annual Expected Returns: 10.8%
Roper Technologies is a specialized industrial company that manufactures products such as medical and scientific imaging equipment, pumps, and material analysis equipment.
Roper Technologies also develops software solutions for the healthcare, transportation, food, energy, and water industries. The company was founded in 1981, generates around $7.0 billion in annual revenues, and is based in Sarasota, Florida.
On July 21st, 2025, Roper posted its Q2 results for the period ending June 30th, 2025. Quarterly revenues and adjusted EPS were $1.94 billion and $4.87, indicating up 13% and 9% year-over-year, respectively.
The company’s momentum during the quarter remained strong, with organic growth coming in at 7% and acquisitions-driven growth coming in at 6%. Organic growth was once again driven by broad-based strength across its portfolio of niche-leading businesses.
Backed by Roper’s growth momentum, balance sheet strength, and a large pipeline of quality acquisition opportunities, management believes Roper is well positioned for continued double-digit cash flow growth.
Further, Roper increased its adjusted EPS guidance for FY2025, now expecting it to land between $19.90 and $20.05.
Click here to download our most recent Sure Analysis report on ROP (preview of page 1 of 3 shown below):
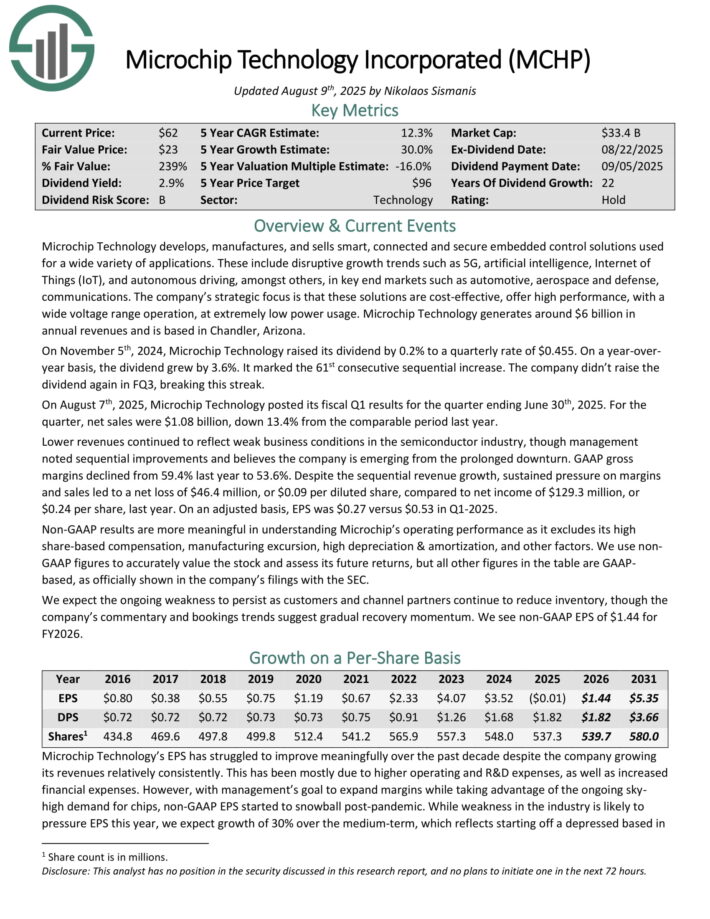
Tech Dividend Stock #8: Microchip Technology (MCHP)
5-Year Annual Expected Returns: 11.0%
Microchip Technology develops, manufactures, and sells smart, connected and secure embedded control solutions used for a wide variety of applications.
These include disruptive growth trends such as 5G, artificial intelligence, Internet of Things (IoT), and autonomous driving, amongst others, in key end markets such as automotive, aerospace and defense, communications.
Microchip Technology generates around $6 billion in annual revenues and is based in Chandler, Arizona.
On August 7th, 2025, Microchip Technology posted its fiscal Q1 results for the quarter ending June 30th, 2025. For the quarter, net sales were $1.08 billion, down 13.4% from the comparable period last year.
Lower revenues continued to reflect weak business conditions in the semiconductor industry, though management noted sequential improvements and believes the company is emerging from the prolonged downturn.
GAAP gross margins declined from 59.4% last year to 53.6%. Despite the sequential revenue growth, sustained pressure on margins and sales led to a net loss of $46.4 million, or $0.09 per diluted share, compared to net income of $129.3 million, or $0.24 per share, last year.
On an adjusted basis, EPS was $0.27 versus $0.53 in Q1-2025.
Click here to download our most recent Sure Analysis report on MCHP (preview of page 1 of 3 shown below):
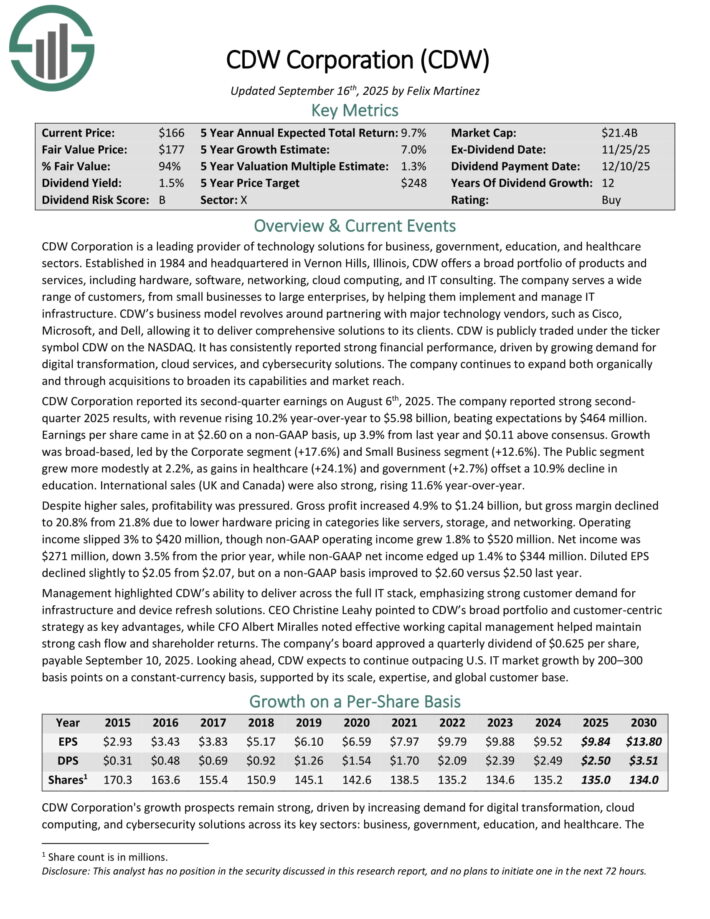
Tech Dividend Stock #7: CDW Corporation (CDW)
5-Year Annual Expected Returns: 11.0%
CDW Corporation is a leading provider of technology solutions for business, government, education, and healthcare sectors.
CDW offers a broad portfolio of products and services, including hardware, software, networking, cloud computing, and IT consulting. The company serves a wide range of customers, from small businesses to large enterprises, by helping them implement and manage IT infrastructure.
CDW Corporation reported its second-quarter earnings on August 6th, 2025. The company reported strong second quarter 2025 results, with revenue rising 10.2% year-over-year to $5.98 billion, beating expectations by $464 million. Earnings per share came in at $2.60 on a non-GAAP basis, up 3.9% from last year and $0.11 above consensus.
Growth was broad-based, led by the Corporate segment (+17.6%) and Small Business segment (+12.6%). The Public segment grew more modestly at 2.2%, as gains in healthcare (+24.1%) and government (+2.7%) offset a 10.9% decline in education. International sales (UK and Canada) were also strong, rising 11.6% year-over-year.
Despite higher sales, profitability was pressured. Gross profit increased 4.9% to $1.24 billion, but gross margin declined to 20.8% from 21.8% due to lower hardware pricing in categories like servers, storage, and networking.
Operating income slipped 3% to $420 million, though non-GAAP operating income grew 1.8% to $520 million. Net income was $271 million, down 3.5% from the prior year, while non-GAAP net income edged up 1.4% to $344 million.
Diluted EPS declined slightly to $2.05 from $2.07, but on a non-GAAP basis improved to $2.60 versus $2.50 last year.
Click here to download our most recent Sure Analysis report on CDW (preview of page 1 of 3 shown below):
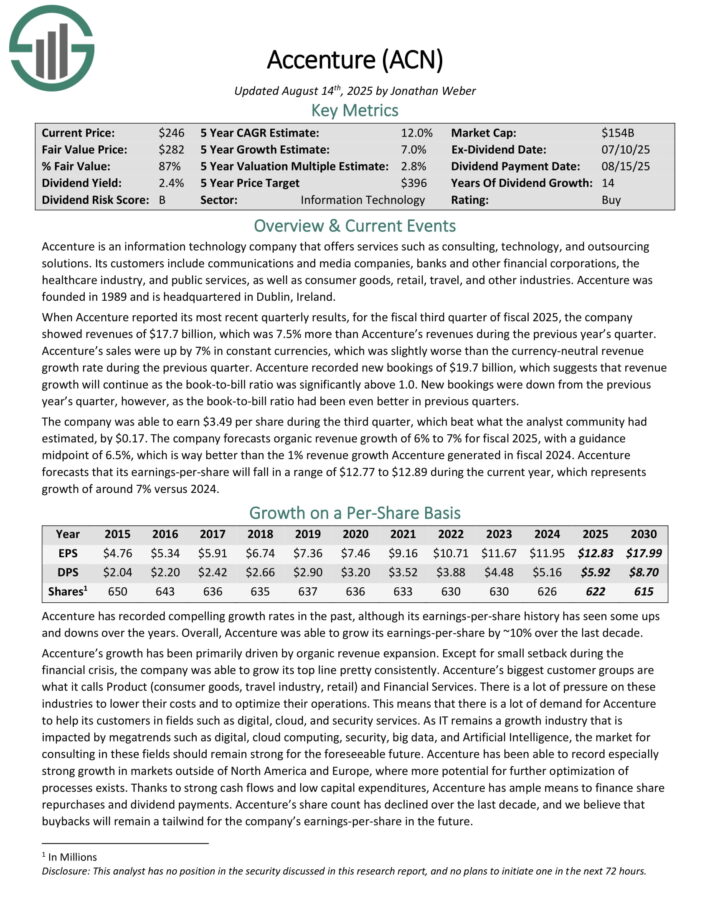
Tech Dividend Stock #6: Accenture (ACN)
5-Year Annual Expected Returns: 11.6%
Accenture is an information technology company that offers services such as consulting, technology, and outsourcing solutions.
Its customers include communications and media companies, banks and other financial corporations, the healthcare industry, and public services, as well as consumer goods, retail, travel, and other industries. Accenture was founded in 1989 and is headquartered in Dublin, Ireland.
When Accenture reported its most recent quarterly results, for the fiscal third quarter of fiscal 2025, the company showed revenues of $17.7 billion, which was 7.5% more than Accenture’s revenues during the previous year’s quarter.
Accenture’s sales were up by 7% in constant currencies, which was slightly worse than the currency-neutral revenue growth rate during the previous quarter.
Accenture recorded new bookings of $19.7 billion, which suggests that revenue growth will continue as the book-to-bill ratio was significantly above 1.0. New bookings were down from the previous year’s quarter, however, as the book-to-bill ratio had been even better in previous quarters.
The company was able to earn $3.49 per share during the third quarter, which beat what the analyst community had estimated, by $0.17.
The company forecasts organic revenue growth of 6% to 7% for fiscal 2025, with a guidance midpoint of 6.5%, which is way better than the 1% revenue growth
Accenture generated in fiscal 2024. Accenture forecasts that its earnings-per-share will fall in a range of $12.77 to $12.89 during the current year, which represents growth of around 7% versus 2024.
Click here to download our most recent Sure Analysis report on ACN (preview of page 1 of 3 shown below):
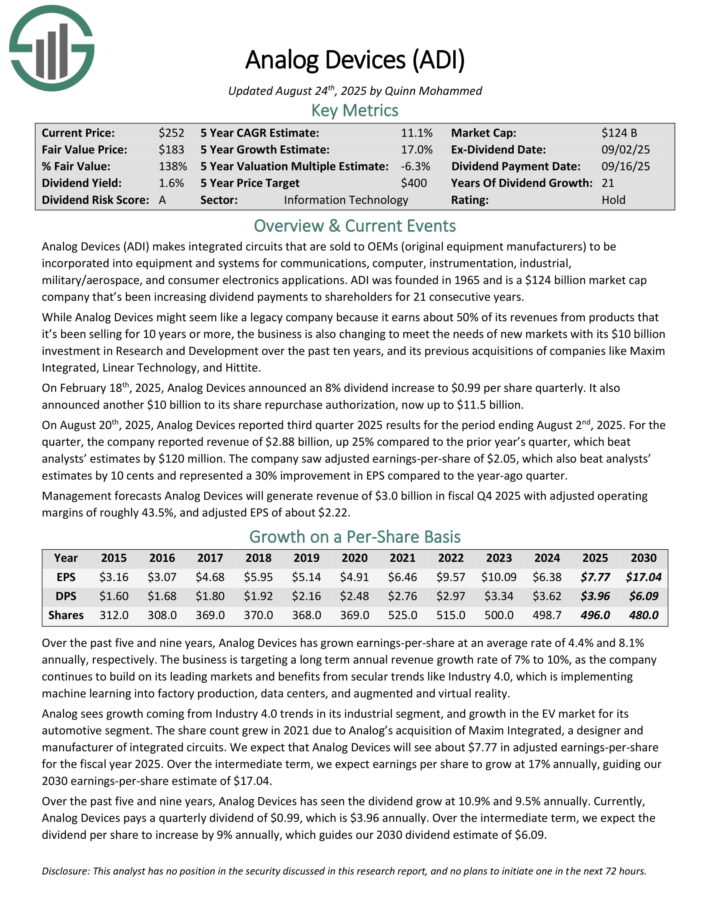
Tech Stock #5: Analog Devices (ADI)
5-Year Annual Expected Returns: 12.0%
Analog Devices (ADI) makes integrated circuits that are sold to OEMs (original equipment manufacturers) to be incorporated into equipment and systems for communications, computer, instrumentation, industrial, military/aerospace, and consumer electronics applications.
ADI has increased dividend payments to shareholders for 21 consecutive years.
On February 18th, 2025, Analog Devices announced an 8% dividend increase to $0.99 per share quarterly. It also announced another $10 billion to its share repurchase authorization, now up to $11.5 billion.
On August 20th, 2025, Analog Devices reported third quarter 2025 results for the period ending August 2nd, 2025. For the quarter, the company reported revenue of $2.88 billion, up 25% compared to the prior year’s quarter, which beat analysts’ estimates by $120 million.
The company saw adjusted earnings-per-share of $2.05, which also beat analyst estimates by 10 cents and represented a 30% improvement in EPS compared to the year-ago quarter.
Management forecasts Analog Devices will generate revenue of $3.0 billion in fiscal Q4 2025 with adjusted operating margins of roughly 43.5%, and adjusted EPS of about $2.22.
Click here to download our most recent Sure Analysis report on ADI (preview of page 1 of 3 shown below):
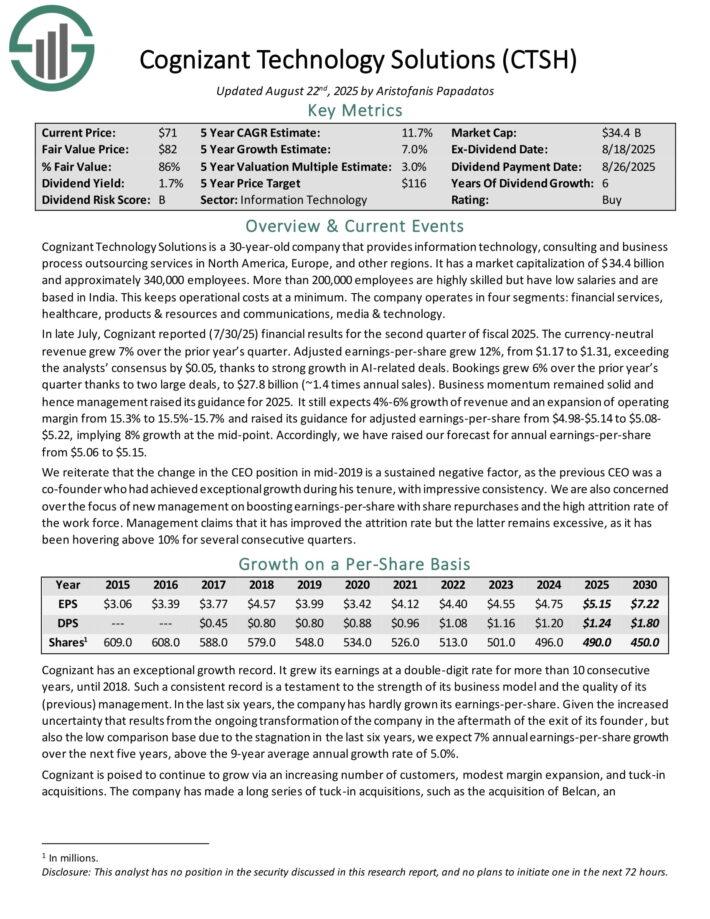
Tech Dividend Stock #4: Cognizant Technology Solutions (CTSH)
5-Year Annual Expected Returns: 12.2%
Cognizant Technology Solutions provides information technology, consulting and business process outsourcing services in North America, Europe, and other regions. The company operates in four segments: financial services, healthcare, products & resources and communications, media & technology.
In late July, Cognizant reported (7/30/25) financial results for the second quarter of fiscal 2025. The currency-neutral revenue grew 7% over the prior year’s quarter. Adjusted earnings-per-share grew 12%, from $1.17 to $1.31, exceeding the analysts’ consensus by $0.05, thanks to strong growth in AI-related deals.
Bookings grew 6% over the prior year’s quarter thanks to two large deals, to $27.8 billion (~1.4 times annual sales). Business momentum remained solid and hence management raised its guidance for 2025.
It still expects 4%-6% growth of revenue and an expansion of operating margin from 15.3% to 15.5%-15.7% and raised its guidance for adjusted earnings-per-share from $4.98-$5.14 to $5.08-$5.22, implying 8% growth at the mid-point.
Accordingly, we have raised our forecast for annual earnings-per-share from $5.06 to $5.15.
Click here to download our most recent Sure Analysis report on CTSH (preview of page 1 of 3 shown below):
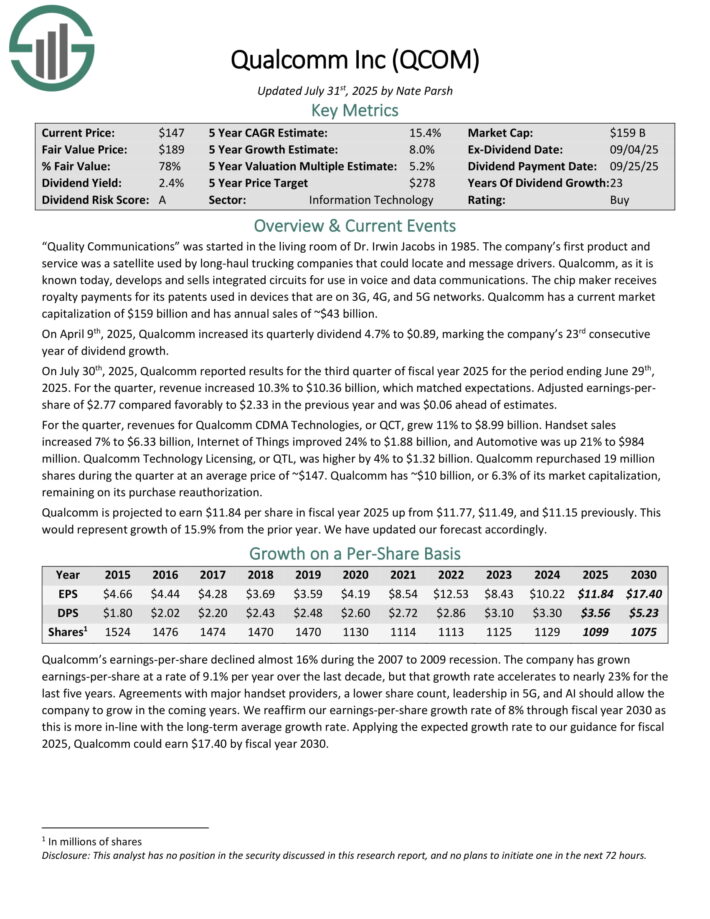
Tech Dividend Stock #3: Qualcomm Inc. (QCOM)
5-Year Annual Expected Returns: 12.2%
Qualcomm develops and sells integrated circuits for use in voice and data communications. The chip maker receives royalty payments for its patents used in devices that are on 3G, 4G, and 5G networks. Qualcomm has annual sales of ~$43 billion.
On July 30th, 2025, Qualcomm reported results for the third quarter of fiscal year 2025. For the quarter, revenue increased 10.3% to $10.36 billion, which matched expectations. Adjusted earnings-per-share of $2.77 compared favorably to $2.33 in the previous year and was $0.06 ahead of estimates.
For the quarter, revenues for Qualcomm CDMA Technologies, or QCT, grew 11% to $8.99 billion. Handset sales increased 7% to $6.33 billion, Internet of Things improved 24% to $1.88 billion, and Automotive was up 21% to $984 million.
Revenue for Qualcomm Technology Licensing, or QTL, was higher by 4% to $1.32 billion. Qualcomm repurchased 19 million shares during the quarter at an average price of ~$147.
Qualcomm has ~$10 billion, or 6.3% of its market capitalization, remaining on its purchase re-authorization.
Click here to download our most recent Sure Analysis report on QCOM (preview of page 1 of 3 shown below):
Tech Stock #2: Intuit Inc. (INTU)
5-Year Annual Expected Returns: 12.6%
Intuit is a cloud-based accounting and tax preparation software giant, headquartered in Mountain View, California. Its products provide financial management, compliance, and services for consumers, small businesses, self-employed workers, and accounting professionals worldwide.
Its most popular platforms include QuickBooks, TurboTax, Mint, and TSheets. Cumulatively they serve more than 100 million customers. The company recorded $18.8 billion in revenue last year and is headquartered in Mountain View, California.
On August 21st, 2025, Intuit raised its dividend by 15% to a quarterly rate of $1.20.
On the same day, Intuit posted its fiscal Q4 and full-year results for the period ending July 31st, 2025. This was another strong quarter, with “Global Business Solutions Group” revenue up 18% year-over-year.
Specifically, QuickBooks Online Accounting revenues grew 23% year-over-year, driven by customer growth, higher effective prices, and mix-shift.
Online Services revenues grew 19%, driven by growth in money and payroll offerings. Finally, total international online revenue grew 9% on a constant-currency basis.
Total revenues for the quarter reached $3.83 billion, up 20% year-over-year. Adjusted EPS for the quarter rose by 38% to $2.75 compared to FQ4 2024. Adjusted EPS was a record $20.15 for FY2025.
Management provided outlook for FY2026. Revenues are expected to be in a range of $20.997 billion to $21.186 billion, implying a growth rate of about 12% to 13% from last year.
Adjusted EPS is expected to be between $22.98 and $23.18, implying a year-over-year growth of about 14% to 15%.
Click here to download our most recent Sure Analysis report on INTU (preview of page 1 of 3 shown below):

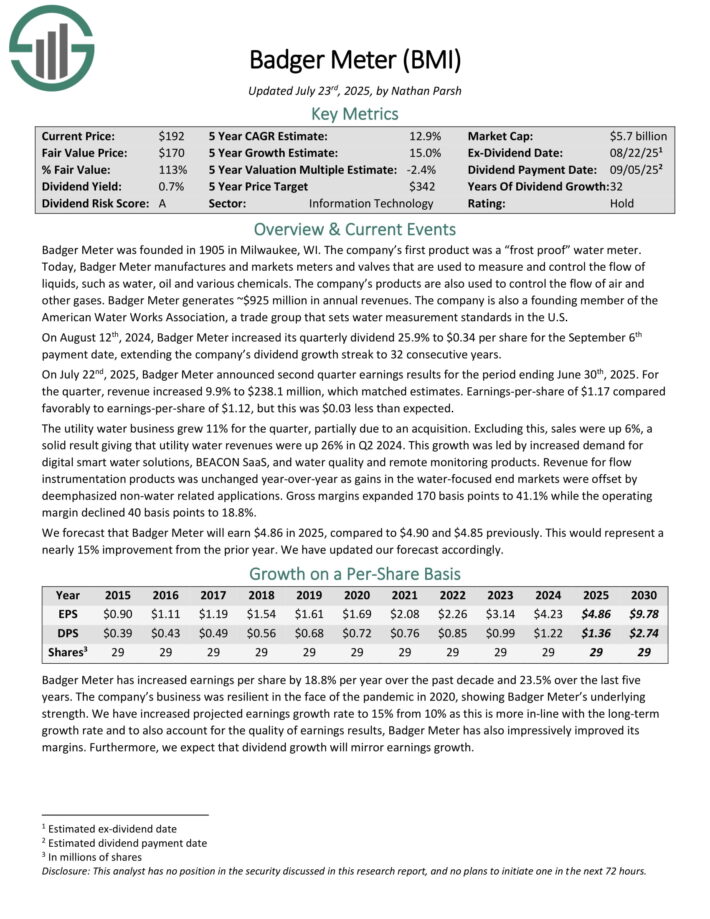
Tech Dividend Stock #1: Badger Meter (BMI)
5-Year Annual Expected Returns: 14.5%
Badger Meter manufactures and markets meters and valves that are used to measure and control the flow of liquids, such as water, oil and various chemicals.
Its products are also used to control the flow of air and other gases. Badger Meter generates ~$925 million in annual revenues.
On July 22nd, 2025, Badger Meter announced second quarter earnings results for the period ending June 30th, 2025. For the quarter, revenue increased 9.9% to $238.1 million, which matched estimates.
Earnings-per-share of $1.17 compared favorably to earnings-per-share of $1.12, but this was $0.03 less than expected.
The utility water business grew 11% for the quarter, partially due to an acquisition. Excluding this, sales were up 6%, a solid result giving that utility water revenues were up 26% in Q2 2024.
This growth was led by increased demand for digital smart water solutions, BEACON SaaS, and water quality and remote monitoring products.
Revenue for flow instrumentation products was unchanged year-over-year as gains in the water-focused end markets were offset by de-emphasized non-water related applications.
Gross margins expanded 170 basis points to 41.1% while the operating margin declined 40 basis points to 18.8%.
We forecast that Badger Meter will earn $4.86 in 2025, compared to $4.90 and $4.85 previously. This would represent a nearly 15% improvement from the prior year.
Click here to download our most recent Sure Analysis report on BMI (preview of page 1 of 3 shown below):
Final Thoughts
The technology sector has become an intriguing place to look for high-quality dividend investment opportunities.
With that said, it is not the only place to look for investment ideas.
If you’re willing to venture outside of the technology sector, the following databases contain some of the most high-quality dividend stocks around:
The Dividend Achievers List: Dividend stocks with 10+ years of consecutive dividend increases
The Dividend Kings List: Dividend stocks with 50+ years of consecutive dividend increases
The Blue Chip Stocks List: Dividend stocks that qualify as either Dividend Achievers, Dividend Aristocrats, and/or Dividend Kings
The High Dividend Stocks List: stocks that appeal to investors interested in the highest yields of 5% or more.
The Monthly Dividend Stocks List: stocks that pay dividends every month, for 12 dividend payments per year.
The Dividend Champions List: stocks that have increased their dividends for 25+ consecutive years.Note: Not all Dividend Champions are Dividend Aristocrats because Dividend Aristocrats have additional requirements like being in The S&P 500.
If you’re looking for other sector-specific dividend stocks, the following Sure Dividend databases will be useful:
Thanks for reading this article. Please send any feedback, corrections, or questions to [email protected].


")


