No Result
View All Result
  • Login
Sunday, September 28, 2025
FeeOnlyNews.com
  • Home
  • Business
  • Financial Planning
  • Personal Finance
  • Investing
  • Money
  • Economy
  • Markets
  • Stocks
  • Trading
  • Home
  • Business
  • Financial Planning
  • Personal Finance
  • Investing
  • Money
  • Economy
  • Markets
  • Stocks
  • Trading
No Result
View All Result
FeeOnlyNews.com
No Result
View All Result
Home Investing

Is the 60/40 Portfolio Still Relevant?

by FeeOnlyNews.com
2 years ago
in Investing
Reading Time: 9 mins read
A A
0
Is the 60/40 Portfolio Still Relevant?
Share on FacebookShare on TwitterShare on LInkedIn


How have different portfolio allocations performed throughout the world?

Amid recent market turbulence, the worst year ever for US bonds, persistent inflation, and the looming threat of slower growth or even recession, this is a critical question, especially given the current debate about the efficacy of the traditional 60/40 portfolio. To answer it, we evaluate the performance of portfolios with asset allocations of 100% equity, 100% bond, 60/40, and 80/20 in the US, UK, Italian, Swiss, and global markets over time on both a lumpsum and dollar-cost averaging (DCA) basis.

We chose these markets because they have widely available liquid instruments with which to execute our strategies as well as varying levels of volatility.

We build all of our hypothetical portfolios with exchange-traded funds (ETFs) except for the world bond allocation. We gathered close price data for the ETFs and net asset values for the global bond fund and reinvested/accumulated the dividends across our 10-year holding period from 31 December 2012 to 31 December 2022. Each country’s funds are priced in local currency and the world funds in US dollars. The only Swiss bond ETF with 10 years of return history had a targeted maturity of 7 to 15 years.

Portfolio Strategy Components

UnitedStatesEquitySPDR S&P 500ETF Trust(SPY) BondsiShares US Treasury Bond(GOVT)UnitedKingdomEquityiShares CoreFTSE 100 UCITSETF (ISF) BondsiShares Core UK GiltsUCITS ETF (IGLT)ItalyEquityLyxor FTSE MIBUCITS ETF(MIB) BondsiShares ItalyGovt BondUCITS ETF (IITB)SwitzerlandEquityiShares SMIETF (CSSMI) BondsiShares Swiss DomesticGovt Bond 7-15 ETF (CSBGC0)GlobalEquityiShares: MSCI World (URTH) BondsiShares GlobalGovernmentBond Index (LU)F2 USD

We backtested and calculated each strategy’s annualized total return based on a 120,000 investment in the local currency. For the lumpsum approach, we invested the full 120,000 on 31 December 2012. For the DCA approach, we split the total investment into 1,000 local currency cash flows each month for 120 months, from 31 December 2012 to 31 December 2022.

We excluded transaction costs since they are likely to be small for the lumpsum strategy, and while presumably higher for the DCA method, they should not qualitatively affect our results.

Graphic for Handbook of AI and Big data Applications in Investments

Annualized Return Performance: Lumpsum vs. DCA

The annualized returns for the lumpsum approach in each country and the world portfolio, visualized in the graphic below, demonstrate that only the 100% US equity portfolio fared better than the 100% global equity portfolio, while the 100% bond portfolios of all four countries beat their world counterpart. Each 80/20 allocation generated higher returns than its same-market 60/40 peer.

Lumpsum Annualized Returns

Source: Refinitiv Data

The US equity market displayed relatively high returns at the outset compared to those of the other three countries, and all US portfolios save the 100% bond allocation performed well. But these results come with a big caveat: They depend on our precise 10-year timeframe and cannot be generalized out of sample. Further, not all investors, whether retail or institutional, follow a lumpsum approach in the accumulation phase. This is why we conducted our DCA analysis.

How did the DCA strategy perform in comparison? All four country markets show similar trends, as depicted in the following graphic: All 100% bond allocations had negative annualized returns. Only 100% US equity outperformed 100% world equity. As with the lumpsum analysis, 80/20 outpaced 60/40 portfolios.

Dollar-Cost Averaging Annualized Returns

Source: Refinitiv Data

Comparing Holding Periods

To isolate the impact of dismal 2022 bond returns, we ended the holding period on 31 December 2021 instead of 31 December 2022 and reduced our investment amount to 108,000 from 120,000. This increased annualized returns for bonds and equity across the board for the DCA approach. The 100% US equity strategy improved the most, generating 6.56% higher returns.

So how did the lumpsum strategy perform during both holding periods for a 100% equity allocation and a 100% bond allocation in each country? The subsequent graphic distills our results.

Lumpsum: 100% Equity vs. 100% Bond Portfolios

charts showing Lumpsum: 100% Equity vs. 100% Bond Portfolios over two holding periods
Source: Refinitiv Data

For comparison, the visualization below shows how the 60/40 and 80/20 allocations in each market fared over both time windows.

The equity and bond funds in each category and all 60/40 and 80/20 portfolios exhibited significantly higher returns when the holding period ended on 31 December 2021 rather than 31 December 2022.

Lumpsum: 60/40 vs. 80/20 Portfolios

Chart showing Lumpsum: 60/40 vs. 80/20 Portfolios over two time horizons
Source: Refinitiv Data

Volatility

Using average monthly returns, we calculated each strategy’s standard deviation and multiplied it by the square root of 12 to annualize it. The standard deviations of the funds in each category increased in 2022 as equity and bond market volatility rose globally, as shown in the following table.

Standard Deviations

Through 2021Through 2022US Equity13.33%14.75%US Bond3.67%4.27%UK Equity12.14%12.21%UK Bond6.80%7.92%Italian Equity20.79%20.93%Italian Bond5.81%6.39%Swiss Equity11.90%12.37%Swiss Bond4.88%5.73%Global Equity13.45%14.74%Global Bond5.09%5.96%

Italian equities demonstrate the most volatility and the UK and Swiss the least, while US equity volatility correlates closely with its world counterpart. The US and Swiss bond markets were the most stable.

Ad for Factor Investing and Asset Allocation

Sharpe Ratios

To understand each strategy’s risk-adjusted returns, we calculated their Sharpe ratios. For the risk-free rate, we use the average 10-year treasury rate of the respective country as well as the average 10-year US Treasury rate for the global portfolios since they are US-dollar denominated. Our results over the two time samples, presented in the two subsequent charts, show that all Sharpe ratios are higher/better for the time period ending in 2021 except for the Italian 80/20 portfolio. This indicates that equity and bond markets did better globally on a risk-adjusted basis in 2021 than 2022.

Relative to the 100% world equity allocation, the US and Swiss varieties had higher Sharpe ratios and their UK and Italian peers lower ones over the two timeframes. The 100% bond allocations in all four countries exhibited higher Sharpe ratios than their global counterpart.

Sharpe Ratios through 2021

100% Equity100% Bond60/4080/20US Portfolio1.060.031.111.08UK Portfolio0.130.310.250.18Italian Portfolio0.400.390.440.35Swiss Portfolio0.890.230.940.72Global Portfolio0.79-0.270.680.75

Sharpe Ratios through 2022

100% Equity100% Bond60/4080/20US Portfolio0.73-0.360.650.70UK Portfolio0.12-0.110.010.10Italian Portfolio0.31-0.010.280.44Swiss Portfolio0.65-0.080.590.46Global Portfolio0.51-0.570.320.44

When the holding period ended in 2021, the 60/40 portfolios had higher Sharpe ratios than the 80/20s. At the year-end 2022, all 80/20 portfolios save Switzerland’s had higher Sharpe ratios. Since the risk-adjusted performance of bonds was worse than that of equities through this timeframe, allocating a higher percentage to bonds — 40% to only 20% — yielded poorer results.

The global 80/20 portfolio’s Sharpe ratio was higher than the 60/40’s in both time samples but especially in the one ending in 2022. The higher volatility, high-inflation, and rising interest rate environment of 2022 clearly sabotaged bond performance and played an outsized role in our results.

ESG Certificate ad from CFA Instiute

Looking Ahead

What are the takeaways from this analysis? First, the lumpsum method did well across all markets and portfolios that allocated to equity. Of course, such a method requires having a lumpsum to invest, and success hinges in part on market timing. Moreover, investors might be emotionally resistant to investing a lumpsum amid a market downturn. The DCA approach, on the other hand, smooths the effect of market fluctuations on the portfolio and thus reduces timing risk.

Based on the lumpsum Sharpe ratios, the 100% equity portfolio had the best risk-adjusted performance through 2022 in all markets save Italy. For the period ending 31 December 2021, the 60/40 allocation fared best on a risk-adjusted basis in each country but not globally. The 80/20 allocation did better than 100% equity and 100% bond allocations in some markets and worse in others. Overall, the bond disaster of 2022 dragged down annualized and risk-adjusted returns.

To draw further conclusions about the utility of the 60/40 portfolio versus the 80/20 or any other allocation strategy requires further research. Indeed, our colleagues are in the midst of conducting it. But as our analysis shows, a portfolio redeemed at year-end 2021 would have outperformed the same portfolio redeemed at year-end 2022. This is a good reminder of the risk of end-point bias in any time series analysis.

To be sure, our investigation has limitations beyond those mentioned above. It does not account for the impact of foreign currency conversions, exclusively focuses on developed markets, and has an abbreviated investing period. Nevertheless, it does provide a window into how different asset allocation strategies played out over the past decade and illustrates how the 60/40 portfolio can add to risk-adjusted returns and how outlier years can drag down performance.

Rhodri Preece, CFA, David Terris, CIPM, and Karyn D. Vincent, CFA, CIPM, contributed to this article.

If you liked this post, don’t forget to subscribe to Enterprising Investor.

All posts are the opinion of the author. As such, they should not be construed as investment advice, nor do the opinions expressed necessarily reflect the views of CFA Institute or the author’s employer.

Image credit: ©Getty Images / alexsl

Professional Learning for CFA Institute Members

CFA Institute members are empowered to self-determine and self-report professional learning (PL) credits earned, including content on Enterprising Investor. Members can record credits easily using their online PL tracker.


Source link

Tags: Portfoliorelevant
ShareTweetShare
Next Post

Book Review: A History of Financial Technology and Regulation

Related Posts

Google Searches For “Mortgage Help” Skyrocket to Highest Point Since 2009

Google Searches For “Mortgage Help” Skyrocket to Highest Point Since 2009

by FeeOnlyNews.com
September 26, 2025
0

In This Article Google Trends offers a snapshot of the popularity of search inquiries across its platform. It’s an invaluable...

Monthly Dividend Stock In Focus: Ellington Residential Mortgage REIT

Monthly Dividend Stock In Focus: Ellington Residential Mortgage REIT

by FeeOnlyNews.com
September 26, 2025
0

Updated on September 26th, 2025 by Bob Ciura Real estate investment trusts sometimes have high dividend yields in excess of...

All 61 Consumer Staples Stocks List From Major Sector ETFs Now

All 61 Consumer Staples Stocks List From Major Sector ETFs Now

by FeeOnlyNews.com
September 26, 2025
0

Data updated dailyArticle updated on September 26th, 2025 by Bob Ciura The consumer staples sector is home to some of...

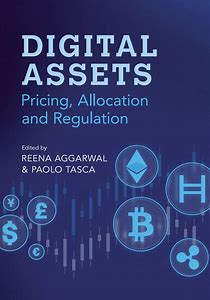
Book Review: Digital Assets: Pricing, Allocation and Regulation

Book Review: Digital Assets: Pricing, Allocation and Regulation

by FeeOnlyNews.com
September 26, 2025
0

Digital Assets: Pricing, Allocation and Regulation 2025. Edited by Reena Aggarwal and Paolo Tasca. Cambridge University Press. www.cambridge.org Digital Assets...

Mild Correction, Any Signs of a Crash?

Mild Correction, Any Signs of a Crash?

by FeeOnlyNews.com
September 26, 2025
0

The housing market is cooling down, but the deals are heating up as a “mild” correction slows down hot markets...

Enterprise Products Partners: An Undervalued High-Yield MLP For An Overpriced Market

Enterprise Products Partners: An Undervalued High-Yield MLP For An Overpriced Market

by FeeOnlyNews.com
September 25, 2025
0

This is a guest contribution by Tom Hutchinson, Chief Analyst, Cabot Dividend Investor The market just keeps on going. Both...

Next Post
Book Review: A History of Financial Technology and Regulation

Book Review: A History of Financial Technology and Regulation

Do the Best Equity Fund Managers Follow the Bond Market?

Do the Best Equity Fund Managers Follow the Bond Market?

  • Trending
  • Comments
  • Latest
Bitcoin: Breakout Above 7K Resistance Could Unlock Fresh Upside

Bitcoin: Breakout Above $117K Resistance Could Unlock Fresh Upside

September 19, 2025
Of Property Rights, Civil Society, and Shampoo

Of Property Rights, Civil Society, and Shampoo

September 1, 2025
Vanguard reaches .5M SEC settlement

Vanguard reaches $19.5M SEC settlement

August 29, 2025
James Galbraith: Crash in Top Economist Hiring Contradicts Elite-Favoring “Skill Biased Technical Change” Theory

James Galbraith: Crash in Top Economist Hiring Contradicts Elite-Favoring “Skill Biased Technical Change” Theory

September 2, 2025
Russia appeals global aviation agency’s decision blaming it for downing MH17 over Ukraine in 2014

Russia appeals global aviation agency’s decision blaming it for downing MH17 over Ukraine in 2014

September 19, 2025
OpenAI, Oracle, and Softbank expand Stargate with five new AI data centers

OpenAI, Oracle, and Softbank expand Stargate with five new AI data centers

September 23, 2025
The Principle of Proportionality | Mises Institute

The Principle of Proportionality | Mises Institute

0
Incyte (INCY) Advances Clinical Trials for Povorcitinib Across Multiple Conditions

Incyte (INCY) Advances Clinical Trials for Povorcitinib Across Multiple Conditions

0
Stocks to watch this week: Hindustan Copper, NLC India among five picks with potential gains up to 28% – Trend tracker

Stocks to watch this week: Hindustan Copper, NLC India among five picks with potential gains up to 28% – Trend tracker

0
How to Separate Genuine Financial Advice From a Sales Pitch

How to Separate Genuine Financial Advice From a Sales Pitch

0
Trump asks Supreme Court to back his limits on birthright citizenship and upend how the 14th Amendment’s been interpreted for 125 years

Trump asks Supreme Court to back his limits on birthright citizenship and upend how the 14th Amendment’s been interpreted for 125 years

0
Is the 60/40 Portfolio Still Relevant?

Is the 60/40 Portfolio Still Relevant?

0
Stocks to watch this week: Hindustan Copper, NLC India among five picks with potential gains up to 28% – Trend tracker

Stocks to watch this week: Hindustan Copper, NLC India among five picks with potential gains up to 28% – Trend tracker

September 28, 2025
Ethereum’s Next Milestone: November Fork Targets Scalability And Efficiency – Details

Ethereum’s Next Milestone: November Fork Targets Scalability And Efficiency – Details

September 27, 2025
Trump to meet with top congressional leaders Monday ahead of government shutdown deadline at midnight on Wednesday

Trump to meet with top congressional leaders Monday ahead of government shutdown deadline at midnight on Wednesday

September 27, 2025
Denmark reports drone sightings at military facilities as NATO warns Russia about violating airspace

Denmark reports drone sightings at military facilities as NATO warns Russia about violating airspace

September 27, 2025
Trump asks Supreme Court to back his limits on birthright citizenship and upend how the 14th Amendment’s been interpreted for 125 years

Trump asks Supreme Court to back his limits on birthright citizenship and upend how the 14th Amendment’s been interpreted for 125 years

September 27, 2025
Nvidia (NVDA) Seen as Key AI Beneficiary Despite Risks Tied to OpenAI Funding

Nvidia (NVDA) Seen as Key AI Beneficiary Despite Risks Tied to OpenAI Funding

September 27, 2025
FeeOnlyNews.com

Get the latest news and follow the coverage of Business & Financial News, Stock Market Updates, Analysis, and more from the trusted sources.

CATEGORIES

  • Business
  • Cryptocurrency
  • Economy
  • Financial Planning
  • Investing
  • Market Analysis
  • Markets
  • Money
  • Personal Finance
  • Startups
  • Stock Market
  • Trading

LATEST UPDATES

  • Stocks to watch this week: Hindustan Copper, NLC India among five picks with potential gains up to 28% – Trend tracker
  • Ethereum’s Next Milestone: November Fork Targets Scalability And Efficiency – Details
  • Trump to meet with top congressional leaders Monday ahead of government shutdown deadline at midnight on Wednesday
  • Our Great Privacy Policy
  • Terms of Use, Legal Notices & Disclaimers
  • About Us
  • Contact Us

Copyright © 2022-2024 All Rights Reserved
See articles for original source and related links to external sites.

Welcome Back!

Sign In with Facebook
Sign In with Google
Sign In with Linked In
OR

Login to your account below

Forgotten Password?

Retrieve your password

Please enter your username or email address to reset your password.

Log In
No Result
View All Result
  • Home
  • Business
  • Financial Planning
  • Personal Finance
  • Investing
  • Money
  • Economy
  • Markets
  • Stocks
  • Trading

Copyright © 2022-2024 All Rights Reserved
See articles for original source and related links to external sites.